

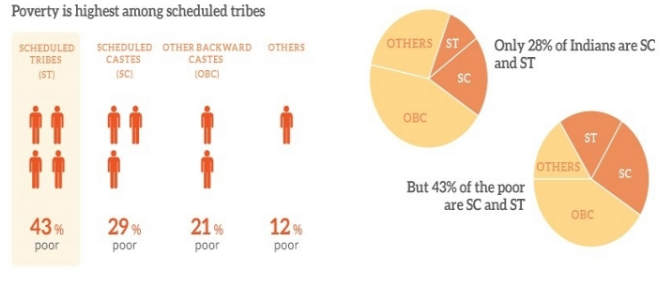
In the 2000s, India’s efforts in reducing poverty bore fruits: the percentage of people below the international poverty line dropped from 38.9% to 21.2%, as per the World Bank. Between 2004 and 2011, 16.2 crore people escaped poverty, a pace that exceeded that of developing the world and middle-income countries. However, the number of poor living in India was 270,000,000 (27 crore) in 2012, as per latest data by the World Bank. Of the total poor, a higher percentage was from Scheduled Castes (SCs) and Scheduled Tribes (STs).
The World Bank, in its latest report, said that India is among emerging economies in the South Asia where strong per capita growth rates are expected to help bring down poverty. While India’s effort at reducing poverty in last seven years can only be assessed once the next round of data on poverty is released, the analysis of 2012 data throws crucial information on India’s poor — where they live, what they spend on, which community they belong to et al.
Here are five charts on India’s poor:

In India, 80% of India’s poor live in rural areas and seven low-income states — Uttar Pradesh, Bihar, Madhya Pradesh, Rajasthan, Jharkhand, Chhattisgarh and Odisha are home to 62% of them.

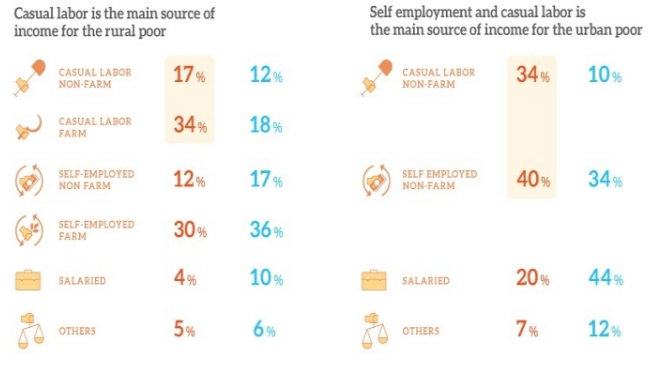
India’s poverty reduction in the 2000s was driven by robust economic growth, increase in rural wages and an increase in non-farm activity especially construction sector.