

‘US stock market is in a bubble’ is something that keeps coming up among social media and news headlines, every time the market indices hit record highs.
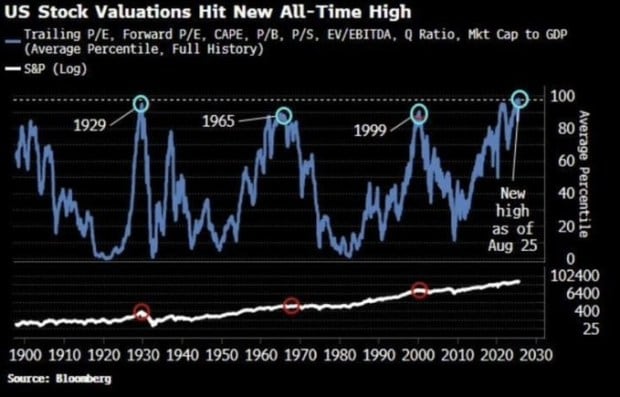
Calling out a bubble in the market means, stocks are being traded at insanely high valuations. According to recent data from Barchart, the U.S. Stock Market has hit its most expensive valuation in history, surpassing the Dot Com Bubble and the run-up to the Great Depression.
Source: Barchart
There are many metrics and indicators used to determine how expensive the market is. Two key metrics are used to measure the market valuations – price-to-earnings ratios and market-cap-to-GDP. As of today, both of these for the US market valuation crossed levels last seen during the 1999 Dot-Com bubble and even the 1929 run-up before the Great Depression.
“A common gauge, the Shiller P/E (CAPE) ratio, stands near 37–38 in mid‑2025, a level last seen at the peak of the dot‑com bubble in 1999.
For context, in 1999, the CAPE hit about 44 before the crash. In fact, analysts note that today’s overall market valuation is slightly above the peak of 1929 and second only to 1999 in the past century. In other words, apart from those two episodes (pre–Great Depression and dot‑com era), US stocks have never been this pricey,” says Subho Moulik, Founder & CEO, Appreciate.
David Rosenberg, founder of Rosenberg Research, is known for his bearish economic outlook, which does not always prove accurate, despite gaining recognition for predicting the 2008 recession.
The S&P 500’s future returns may be negatively impacted by current valuations, as noted by Rosenberg in a recent client communication, according to Business Insider.
The Shiller cyclically adjusted price-to-earnings ratio for the index is currently around 37.5, indicating one of the highest valuations historically, following only 2021 and 2022.
Rosenberg’s data indicate that historically, when the market becomes this expensive, which has only occurred twice before, one-year forward returns have been negative.
Warren Buffett Indicator
The Warren Buffett Indicator is a straightforward comparison of the total value of the US stock market divided by the US GDP. Historically, this indicator has ranged between 90% and 135% but is now at a whopping 207%!
No wonder, at the end of the second quarter of 2025, Berkshire Hathaway holds cash, cash equivalents, and short-term investments in U.S. Treasury bills totaling $344 billion. Is Warren Buffett waiting for a stock market crash?
S&P Valuations
The Dow Jones Industrial Average reached a record high on Friday following Federal Reserve Chair Jerome Powell’s announcement that the central bank may begin cutting rates next month.
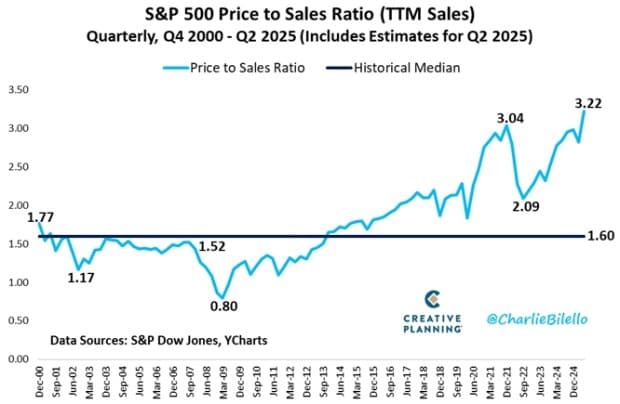
Charlie Bilello, Chief Market Strategist at Creative Planning, in a recent post on X, says – The S&P 500 is now trading at over 3.2x sales, its highest valuation in history.
Currently, S&P 500 companies are showing robust earnings. According to FactSet data, both the percentage of S&P 500 companies reporting positive earnings surprises and the magnitude of earnings surprises are above their 10-year averages.
Tech Bubble
The tech sector now makes up 37% of the total US market capitalisation, which is higher than at the peak of the dot-com bubble in 2000. Over the last few years, investors have piled into tech amid the frenzied excitement about AI.
Nasdaq Composite Index is trading at a price/trailing sales ratio of 6.98, which is 47% higher than its 10-year average valuation of 4.76.
“This extreme valuation is visible in other ways, too. In the late 1990s, the tech-heavy Nasdaq index eventually lost about 78% of its value when the dot-com bubble burst. Similarly, the broader S&P 500 lost roughly half its value in 2000–2002. Prior to the Great Depression, stocks also collapsed on the order of 80–90%. Today’s high P/E ratios and the market’s reliance on a few high-multiple tech names have raised concerns that a similar mean-reversion could occur,” says Moulik.
What Happens Next
History reveals what happened to the market after that high level of valuations. Such extremes are historically rare; the stock market volatility typically increases during this phase.
However, markets may not just turn negative based on high valuations. The famous economist John Maynard Keynes once said, “The markets can remain irrational longer than you can remain solvent.”
Therefore, strong earnings and ample liquidity look to be supporting high stock prices. What may work against it are the downside economic risks.
Bullish sentiments in equities fade when bond yields rise. “Ten‑year Treasury yields have climbed above 4%, which normally makes stocks less attractive relative to fixed income. In past cycles, such yield moves have cooled bull markets,” adds Moulik. After Powell’s comments on probable rate cuts ahead, the yields will be under pressure. It suggests that the bubble may have some more time before it bursts, if at all.