
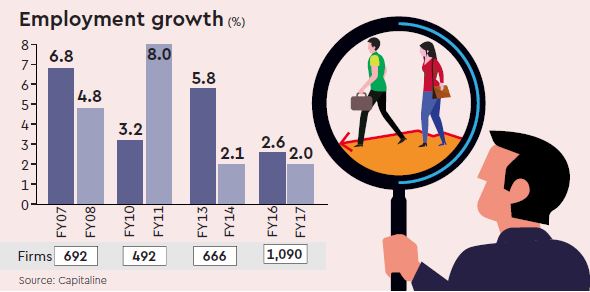
Employment growth in corporate India has fallen off sharply over the last decade, from around 5-6% per annum then to around 2-3% today, Capitaline data show. This is in sharp contrast to the buoyant growth suggested by the addition to those registered with the Employees’ Provident Fund Organisation (EPFO).
Capitaline data for 2,424 firms found they employed a little over 6 million persons in FY17, while 1,033 firms in FY07 employed 3.3 million persons. Since not all firms report employment data, FE created four sets of time periods with a common sample for each time-period to calculate the jobs growth (see graphic). The average number of employees per firm fell from 3,168 in FY07 to 2,501 in FY17.
This is because, over this period, even big firms shed a large number of employees. L&T, for instance, saw employment rise from 21,873 in 2003 to 54,579 in 2014, but this fell to 41,466 in 2017. SAIL saw its numbers fall from 137,496 in 2003 to 101,878 in 2013 and further to 82,964 in 2017. MTNL saw a fall from 58,072 in 2003 to 27,919 in 2017 and Bharti Airtel that saw employment rise from 7,827 in 2005 to 15,563 in 2013 saw this fall to 8,453 in 2018.
A similar trend, though the annual job-growth numbers are different, is shown by Mahesh Vyas’ analysis of CMIE data. His data shows 3,441 firms employed 8.4 million persons in FY17. Since the number of firms have increased over the years, and not all firms report employment data, he has used different common samples for each year to report jobs growth. While employment growth averaged 4% in 2006-2010, this fell to a mere 0.75% in 2013-2017.