
")
The year 2025 has almost wrapped itself in golden glitter. If markets had an award night, the trophy for Best Performing Asset of 2025 would undoubtedly go to Gold. With returns of over 50% till October 2025, Gold has outperformed global equities, crypto favourites like Bitcoin, and almost every traditional asset class.
Indian investors, who have always had an emotional and financial attachment to the yellow metal, have watched this rally in price of gold unfold with excitement. Silver, too, enjoyed a spillover effect, but Gold was the star performer.
Now, with 2026 around the corner, will the rally continue? Or is a breather coming?
To understand this, we must analyse what is happening on both the global and domestic charts.
COMEX Gold Monthly Chart
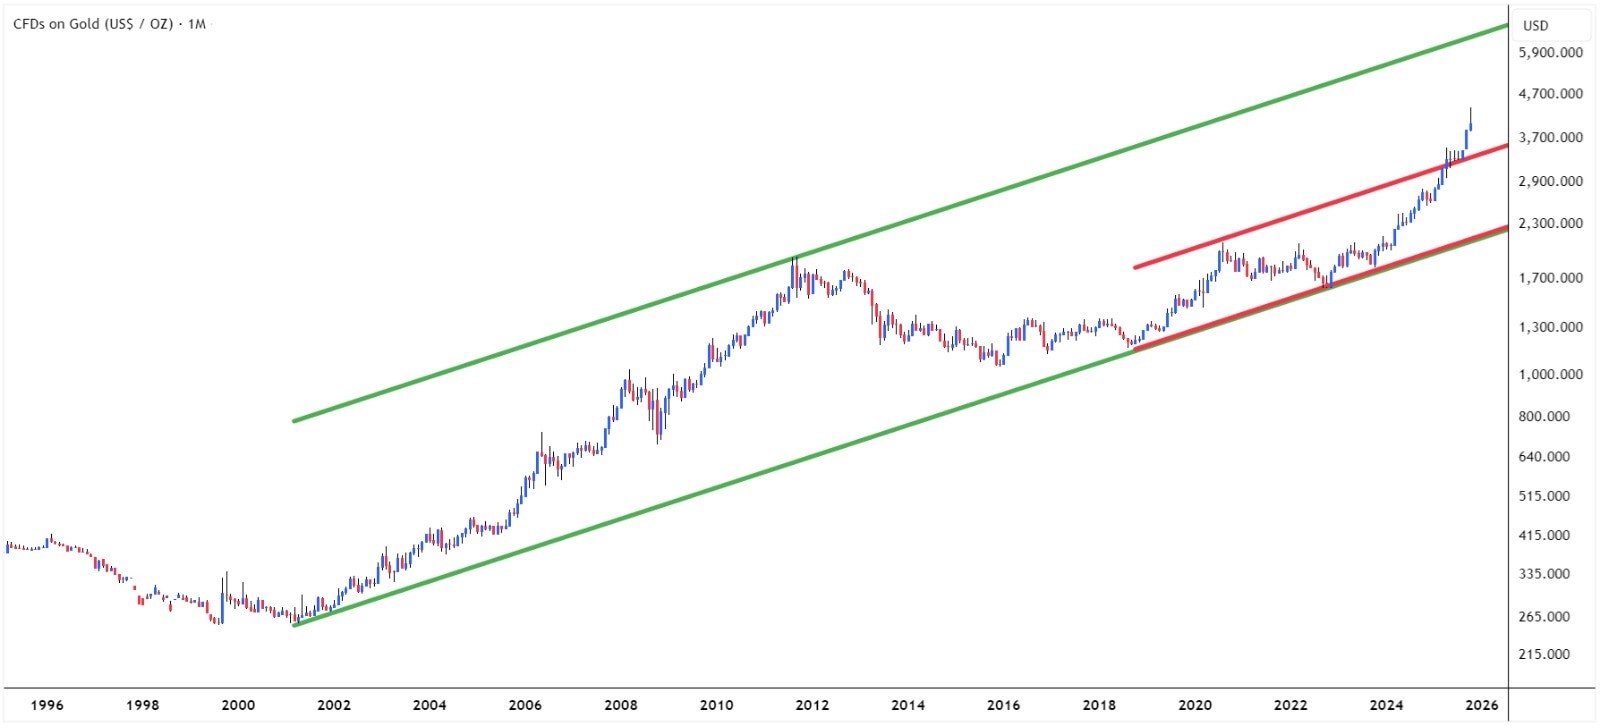
When we step back and look at Gold on the COMEX Monthly chart, a clear story emerges.
If we connect the long-term trendline starting from 2000, Gold continues to move within a multi-year rising channel. This channel represents the primary trend (marked green), and under Dow Theory, the primary trend holds the highest importance. As long as prices respect this trendline, the long-term direction remains strong and positive.
Interestingly, within this primary trend, Gold formed a secondary rising channel (marked red), which recently witnessed a breakout at around $3,250. This breakout was the trigger that charged the bulls and pushed prices aggressively toward $4,380.
A breakout in both primary and secondary trendlines is rare and powerful. It adds weight to the view that Gold still has potential upside over the medium to long term.
The psychological and technical hurdle now sits near $6,000 on the primary channel upper boundary. While this is not a short-term target, it does set the tone for a “north-bound” journey that may unfold during the next upcycle.
MCX Gold: India in Sync with Global Bullishness
MCX Gold Monthly Chart
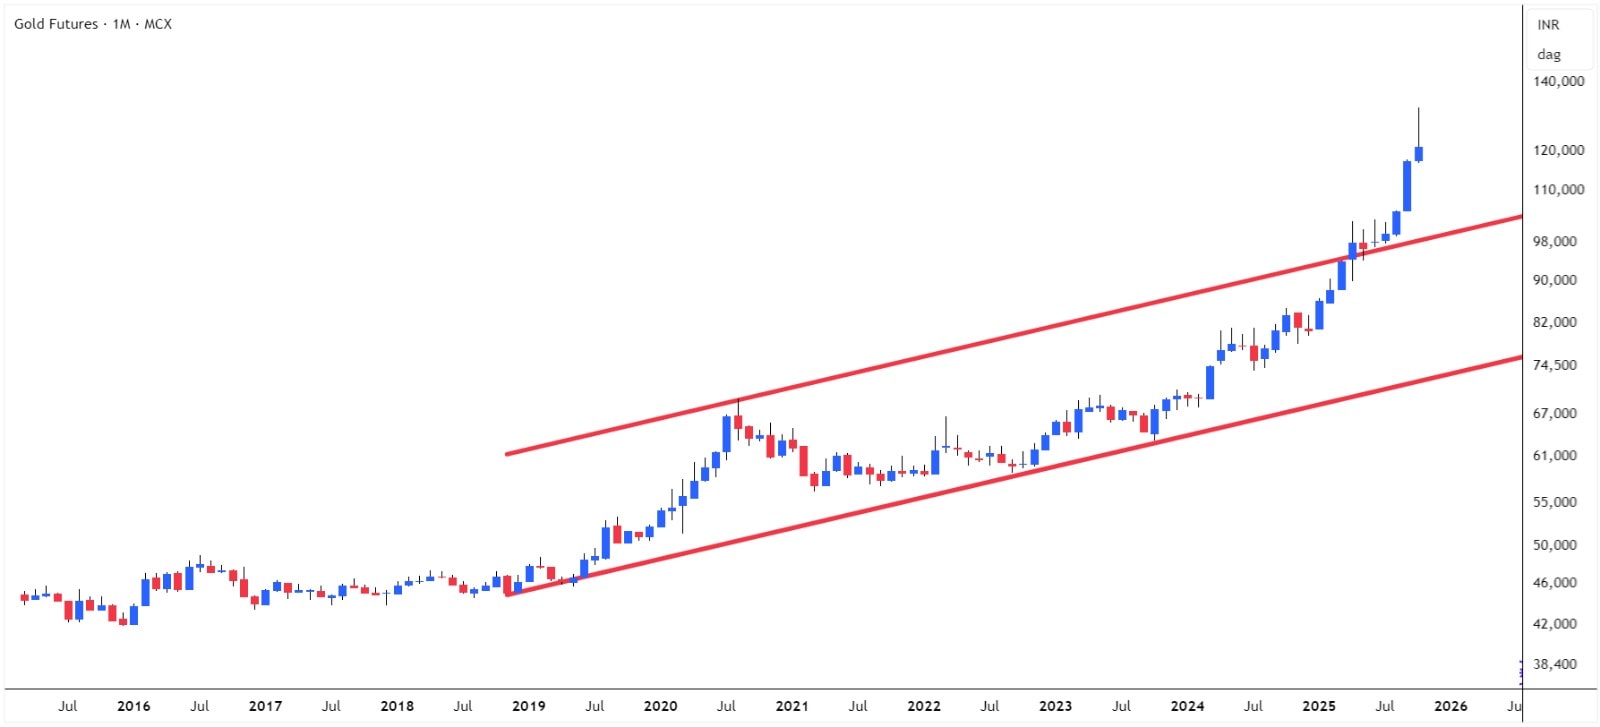
Indian Gold prices usually track global COMEX trends, with the added influence of currency. Over the years, Gold on MCX (Multi-Commodity Exchange) has respected the rising channel beautifully. But the fireworks came when prices finally crossed the Rs. 1,00,000 per 10 gm mark, a level that carried both technical and emotional weight.
This move has now flipped the Rs. 1,00,000 zone from resistance into a key support and demand area. In technical language, this is where buyers are likely to step in aggressively.
If we apply the secondary trend logic from COMEX and assume a possible retest around $3,500, it translates to roughly a 10% pullback from current levels.
On MCX, such a move could cool prices down to around Rs. 96,000, slightly below the support zone of Rs. 1,00,000, a zone that long-term accumulators will be watching closely.
Should Investors Stay Bullish?
From a structural perspective, Gold remains in a long-term uptrend. The COMEX breakout from the secondary trends within the primary bullish trend, and MCX strength above Rs. 1,00,000 are all encouraging signs.
2026 may not offer a straight-line rally, but the wider trend still seems intact. Pullbacks toward Rs. 96,000-1,00,000 could be areas where long-term investors consider accumulating, gradually and with proper risk management.
Disclaimer:
Note: The purpose of this article is only to share interesting charts, data points and thought-provoking opinions. It is NOT a recommendation. If you wish to consider an investment, you are strongly advised to consult your advisor. This article is strictly for educative purposes only.
Brijesh Bhatia is an Independent Research Analyst and is engaged in offering research and recommendation services with SEBI RA Number – INH000022075. He has two decades of experience in India’s financial markets as a trader and technical analyst.
Disclosure: The writer and his dependents do not hold the stocks discussed here.
The website managers, its employee(s), and contributors/writers/authors of articles have or may have an outstanding buy or sell position or holding in the securities, options on securities or other related investments of issuers and/or companies discussed therein. The content of the articles and the interpretation of data are solely the personal views of the contributors/ writers/authors. Investors must make their own investment decisions based on their specific objectives and resources, and only after consulting such independent advisors if necessary.