

Bond yields reveal valuable information about the state of the economy. The yield on a bond is the annual return an investor receives, assuming the bond is held to maturity, and does not default. A bond is risk free if it is issued by a government in its own currency. Why is this? Because a government can always issue currency to repay its debts.
The yield on a risk free bond reflects two things. The first is inflation. Higher inflation implies higher yields. The second is growth. Higher growth implies higher yields. Thus, higher bond yields could be a good or bad sign, depending on the cause.
The current three month yield on Indian government bonds is 5.4%. The three month yield reflects current inflation and growth. The current ten year bond yield is 6.4%. The ten year yield reflects inflation and growth expectations over the next ten years. It also includes a risk premium.
An important statistic is the spread, or the difference between the two. Suppose we compute the spread as the ten year yield minus the three month yield. When the spread is negative, market participants expect growth and inflation to fall. When the spread is large and positive, market participants expect growth and inflation to rise.
Our goal today is to examine whether this spread helps predict future stock returns. The chart below has two plots. The first is the spread each month. The second is the subsequent one year return on the Nifty index. This line tells us what we would earn if we were to hold the market for one year, after observing the value of the spread.
Nifty Future Returns Revealed
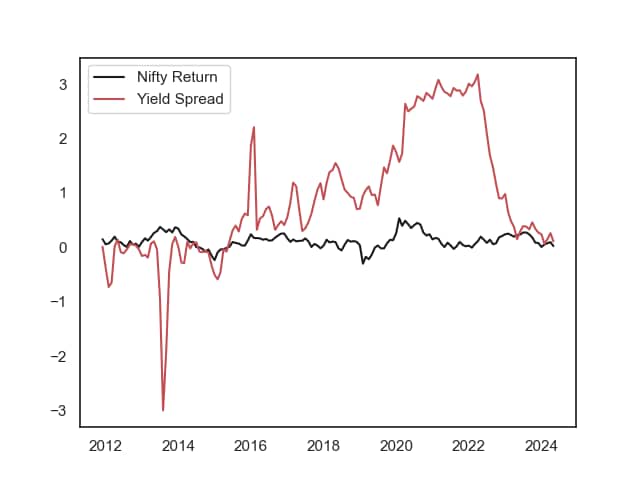
From the plot, we can see that the two lines tend to move in the same direction. When the spread is high, future stock returns are higher. When the spread is low, future stock returns are lower. Connecting this to the economic intuition, when markets expect higher growth or inflation, this implies higher stock returns, and vice versa. Now let’s examine some numbers.
When the spread is positive, the average annual return on the index is 12.9%. When the spread is negative, the average annual return on the index is 7.9%. There is a 5.0% difference between the two numbers, implying a large gap in stock returns, depending on the spread. Thus, the spread does indeed help predict future stock returns.
Going back to the plot, the spread varies a lot more than the return does. And there are some false signals. For example, in 2013, the spread went negative, but stock returns did not follow. While the predictive power of the spread is real, it is also limited. In general, this is true for any predictor of stock returns. For a predictor to be useful, it needs to work more often than it does not work.
Where is the stock market headed?
Right now, the yield spread is positive (around 1%). This is good news for future stock returns, with the standard disclaimer that history does not always repeat.
Disclaimer
Note: The purpose of this article is to share interesting charts, data points and thought-provoking opinions. It is NOT a recommendation. If you wish to consider an investment, you are strongly encouraged to consult your advisor. This article is for strictly educative purposes only.
Asad Dossani is an assistant professor of finance at Colorado State University. His research covers derivatives, forecasting, monetary policy, currencies, and commodities. He has a PhD in Economics. He has previously worked as a research analyst at Equitymaster, and as a financial analyst at Deutsche Bank.
Disclosure: The writer does not hold any of the securities discussed in this article.