

Bank credit movements, the most significant lead indicator, seem submerged under a deluge of market ebullience and positive sentiments. Upbeat analysts predict the economy is recovering; the central bank too expects growth to accelerate this year with a reversal in the corporate investment cycle, while foreign money is pouring in to cash in on the recovery and improved economic outlook. The basis for these views is diverse: A sum of macroeconomic improvements as in internal and external deficits, assisted by recent moderations in oil prices and inflation; activity indicators such as exports, industrial production, PMIs, and so on; rising business and consumer confidence as per various surveys. Strangely, few, if any, are looking at signals from the lubricator and financier of all real activity?bank credit growth. This tells a completely different story, leaving one puzzled as to where the economic conditions really are.
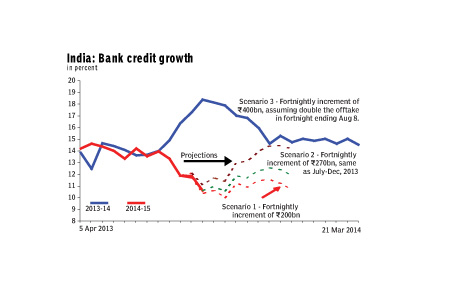
Let us make the picture clearer. The accompanying chart traces the annual growth in non-food bank credit on a fortnightly basis. As we can see, the level of growth during April-July 12, 2014, tracks the previous year?s growth trajectory or in the 13-14% region. But mid-July onwards, the trend began to diverge with deceleration in bank credit growth. The most recent data for the fortnight ending August 8, 2014 shows year-on-year bank credit growth slipped sharply to 11.9% from 13.3% in the preceding fortnight. Was it a one-off decline? Alternatively, could we see a sharp reversal in the credit off take?
To understand how things could unfold in the second and third quarters ahead, we looked at three alternative scenarios built upon incremental changes to outstanding stock of bank credit for the next ten fortnights ending December 26, 2014. The dotted lines in the accompanying chart project credit growth under these hypothetical scenarios: The red dotted line assumes a R200 billion increase in credit off-take each fortnight from August 22 (this is our base line scenario, based upon a R204 billion increase in the fortnight ending August 8). Outstanding bank credit growth then averages 11% in this period, a hefty 5.5 percentage points lower than the comparable period last year. Raising this incremental change to R270 billion on average each fortnight?same as the average increase in July-December, 2013?lifts bank credit growth only slightly, to 11.7% (green dotted line). In the most optimistic scenario 3, we assume a strong upsurge in bank lending following an investment upturn?incremental credit flows are projected to increase an average R400 billion each fortnight (brown dotted line). Credit growth then averages 13% in the period, still 3.7 percentage points lower than the corresponding period last year. To the contrary, if the baseline scenario is not met, credit growth might slip into single digit territory.
What does this signify? Even in our baseline scenario stock of bank credit needs to be raised by R200 billion on average each of the next ten fortnights, a daunting task given a run rate of a little over R100 billion fortnightly averages so far. The eye-catching R1.2 trillion flashed in RBI?s annual report as the amount of new investment that could be realised in FY15 falls far short of the amount that would be needed just to keep the credit growth at a paltry 11% or near about. Needless to say the other two scenarios look far more optimistic in the context of recent trends.
Is there a shift to non-bank finance by firms? A quick review of major non-bank sources of finance reveals that outstanding stocks of certificate of deposits and commercial papers actually contracted a respective 9.8% and 26% year-on-year in the second fortnight of July, as per latest available information, while external commercial borrowings averaged $2.7 billion monthly in the first half of 2014, a tad lower than the $2.75 billion inflow in January-June 2013. Little to suggest a pick-up in non-bank financial resources therefore.
Is the deceleration in credit demand worrying? Few seem concerned that bank credit that finances almost most of the economic activity in India?s bank-dominated financial system is on a significantly weakening path. Banks typically check the economic impulse from the credit-GDP multiplier. Rough estimates are, to be consistent with a 5.5% GDP growth?the mean range of private and official growth forecasts?bank credit growth should be in the 14-15% region. If so, then actual growth trend of credit demand is way lower.
In that case, do current trends in bank credit growth indicate subdued demand and hence, weak economic activity? Apart from the banks, the central bank has for long focused upon bank credit growth as a leading economic indicator; it was a key variable under the former, multiple-indicator framework of monetary policy, reflecting the importance of its signaling properties. It moves closely with the GDP and, in particular, with the industrial cycle. In the April-June period, the little uplift of 13% year-on-year has mostly come from retail, personal loans for housing, credit cards, cars and so on; credit to industry actually contracted.
These trends must reverse sharply for predicted recovery paths to be realised, given the long-term, historical patterns. What is truly puzzling is the vast gulf between this indicator and the behaviour of markets, expectations and outlook of economic agents. From a financing perspective, there seem to be no indications so far that the confidence channel is translating into real economic activity. Why this gap and why are the sobering trends observed in credit growth patterns not being noticed?
The author is a New Delhi-based macroeconomist