


Since the Hindenburg case, the Adani Group has lost a significant amount of market capitalization. After the panic lows, traders and investors have observed some recovery in stocks such as Adani Enterprises, Adani Power, and Adani Ports. But many group stocks are still trading near to panic lows, providing attractive risk-reward opportunities.
Technically, ACC and Adani Green Energy are available with impressive chart setup. Both stocks are indicating signs of strength and accumulation with favorable momentum indicators. Readers may look to add into their watchlist for short to midterm.
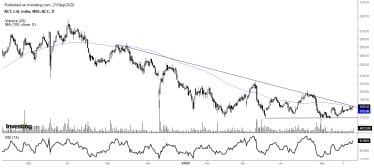
ACC: Building a Base for a Bullish Reversal
The stock price of ACC started its decline in July 2024 from an all time high peak of ₹2,844. It eventually lost 37% of its value in nine months. Starting March 2025, it started trading with support of rising trendline and consolidating between ₹1,700 and ₹2,000.
Despite this, the price action within the range depicted a higher top and higher bottom, which is an early indicator of a reversal. The stock is currently trading above its 100-day moving average, This is considered as the beginning of an uptrend. On top of that, the 14 period RSI is entering into bullish territory, with bullish divergence, and is further enhancing the bullish possibilities. All these factors imply that the stock is setting up to potentially move upwards in the near future.
Key ACC’s Potential Signs of Reversal
- Bullish Triangle pattern: ACC is at verge of giving breakout from descending triangle pattern.
- 100-Day Moving Average: The stock price is trading above its 100DMA, signalling the onset of an uptrend.
- Breakout with Volume: As per current chart setup, the price is rising with rise in volumes, which indicates the bullish sentiment.
- RSI & Price Direction: The 14-period RSI is in the above 60 zone and suggesting that the stock is in strong bullish momentum.

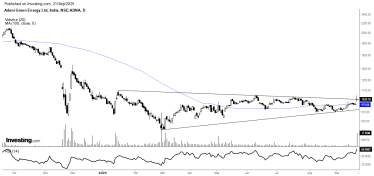
Adani Green Energy: Coiling Up for the Next Move
Adani Green Energy’s share price declined significantly from ₹2,100 to ₹760 between September 2024 to February 2025. The decline subsequently reversed, and the shares have since strongly appreciated from ₹760 to ₹1,070, an increase of 41% between February and June 2025.
After that we can see that the price is trading in a tight range and forming the symmetrical triangle partner. The stock price is trading above important resistance levels and above their 100-day moving average, which is a strong sign.
The 14 period RSI is also suggesting Bullish momentum, which implies the shares are likely to appreciate further. Adani Green Energy has a positive outlook for growth in the near term, given the current technical indicators.
Adani Green Energy’s Stock Reversal Analysis
- Consolidation pattern breakouts: The stock is consolidating in a symmetrical triangle and appears poised to break out.
- Volume Surge Confirming the Breakout: An Increase in price has come with a rise in volume, which shows strong investor interest.
- 100 Day Moving Average: The stock price is trading higher than its 100 DMA. This means, the stock is on an upward trend.
- RSI & Price Direction: The 14-period RSI is in the above 60 zone and showing that the stock is in strong bullish momentum.

Final Take
Since we know the recent development for Adani group of stocks and clean chit from regulator it will help the stock’s price to form bottom. At current juncture we can see ACC and Adani Green Energy looks very promising on chart pattern. Also we approaching to end of monsoon season the real estate activity will pick and it will help cement sectors. Apart from that multiple bullish patterns and a solid chart structure suggest that both stocks have strong potential. Compared to other Adani group of stocks, these two stand out, with favorable setups that could lead to better performance in the upcoming months.
Disclaimer
Note: The purpose of this article is only to share interesting charts, data points and thought-provoking opinions. It is NOT a recommendation. If you wish to consider an investment, you are strongly advised to consult your advisor. This article is strictly for educative purposes only.
Kiran Jani has over 15 years of experience as a trader and technical analyst in India’s financial markets. He is a well-known face on the business channels as Market Experts and has worked with Asit C Mehta, Kotak Commodities, and Axis Securities. Presently, he is Head of the Technical and Derivative Research Desk at Jainam Broking Limited.
Disclosure: The writer and his dependents do not hold the stocks discussed here. However, clients of Jainam Broking Limited may or may not own these securities.
The website managers, its employee(s), and contributors/writers/authors of articles have or may have an outstanding buy or sell position or holding in the securities, options on securities or other related investments of issuers and/or companies discussed therein. The content of the articles and the interpretation of data are solely the personal views of the contributors/ writers/authors. Investors must make their own investment decisions based on their specific objectives and resources, and only after consulting such independent advisors if necessary.


