

")
The festive season in India is a time of joy, celebration, and, surprisingly, predictable market trends. As the sounds of Ganpati celebrations fade and the lights of Diwali approach, a familiar pattern often emerges in the Indian economy.
People feel optimistic, bonuses get paid out, and families decide it’s the right time to buy that new car or bike. The surge in vehicle sales has an indirect effect on the OMC sector. More vehicles on the road mean more fuel consumption; this seasonal demand can be a golden opportunity.
For the stock price of Oil Marketing Companies (OMCs), the period from November to January has historically been a strong one. They often build a solid base in October and then rally through the winter months.

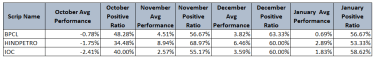
Seasonality analysis indicates that the Indian Oil Corporation Ltd (IOC), Bharat Petroleum Ltd (BPCL), and Hindustan Petroleum Ltd (HPCL) have experienced negative returns between 0.78% and 2.4% in October. But this dip could be the accumulation period for the investors. The period from November to January yields handsome returns, ranging from 8% to a whopping 18%, with HPCL leading the table.
It’s not just about historical data, though. The technical charts for these government-owned giants are also telling a compelling story. They seem to be in the final stages of their potential breakout.
1. Indian Oil Corporation Ltd (IOCL)
When we look at the weekly chart for Indian Oil, a classic bullish pattern emerges; the Higher High – Higher Low.
After a powerful rally that took the stock to a high of Rs 193 from Rs 85 between 2023 and early 2024, the price took a breather.

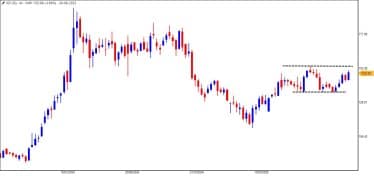
The “higher lows” is a sign of quiet accumulation as it indicates that buyers are confident and willing to step in and purchase the stock at increasingly higher prices. If the stock price manages to break the hurdle of Rs 155-160, it would confirm the breakout from the previous hurdle, which may potentially lead the stock towards a new all-time high.
2. Hindustan Petroleum Corporation Limited (HPCL)
The weekly chart of HPCL highlights a prolonged consolidation phase, with the stock trading sideways within a broad range of Rs. 300 and Rs. 450 for over a year.
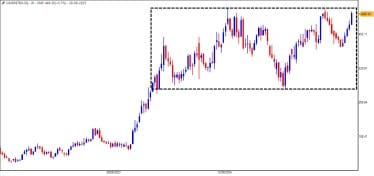
The stock is attempting to break out of this range, with the hurdle placed at Rs. 460. A breakout would potentially confirm the renewed trend on the chart.
3. Bharat Petroleum Corporation Limited (BPCL)
Rounding out our trio is BPCL, as the charts mirror its peers. The Cup & Handle pattern is visible on the chart, indicating the end of the consolidation zone and the beginning of the new trend as soon as it breaks from the handle placed at Rs. 360.
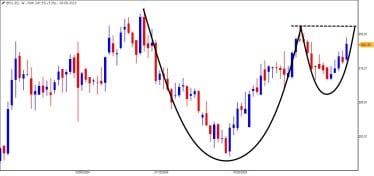
Like the others, BPCL stands to benefit from India’s rising fuel demand and its own expanding footprint in natural gas and renewable energy.
Seasonality edge for traders
The convergence of festive demand, favourable seasonality, and bullish technical patterns makes a strong case for IOCL, HPCL, and BPCL. The strategy is simple – accumulate in October while prices are consolidating and aim to ride the potential rally through November, December, and January.
However, a word of caution is always necessary. The stock market is never a one-way street. Geopolitical events could cause crude oil prices to spike, or a sudden shift in government policy could change the chart structure.
Disclaimer:
Note: The purpose of this article is only to share interesting charts, data points and thought-provoking opinions. It is NOT a recommendation. If you wish to consider an investment, you are strongly advised to consult your advisor. This article is strictly for educative purposes only.
Brijesh Bhatia, is registered with SEBI as Research Analyst with registration no. INH000022075. The Research Analyst got its registration on July 28, 2025 and is engaged in offering research and recommendation services. He has over 18 years of experience in India’s financial markets as a trader and technical analyst.
Disclosure: The writer and his dependents do not hold the stocks discussed here. However, the stock/s discussed here could have been recommended via the research services to which the writer contributes.
The website managers, its employee(s), and contributors/writers/authors of articles have or may have an outstanding buy or sell position or holding in the securities, options on securities or other related investments of issuers and/or companies discussed therein. The content of the articles and the interpretation of data are solely the personal views of the contributors/ writers/authors. Investors must make their own investment decisions based on their specific objectives and resources, and only after consulting such independent advisors if necessary.


