


The Nifty50, after sliding from a high of 25,669 to a low of 24,337 for six weeks, has finally staged a strong comeback. The truncated last week brought an end to the protracted downturn, but it was the start of the new week that truly set the stage for a spectacular reversal. The positive news on the GST front, announced over the weekend, seems to be changing the market’s sentiment from one of despondency to one of renewed optimism.
Among the various sectors, the auto industry emerged as the biggest beneficiary of the GST news, triggering a strong bullish momentum, a trend that we believe has the potential to be sustained in the coming weeks.
The three auto giants are showing the potential strength on the charts.
Maruti Suzuki: Breaking Free After a Year-Long Consolidation
When one thinks of passenger cars in India, Maruti Suzuki is often the first name that comes to mind.
Maruti Suzuki Daily Chart

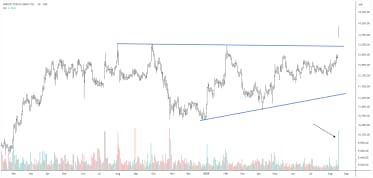
On the daily chart, it broke out from a symmetrical triangle pattern, a long-term consolidation structure that had held the stock in a tight range for 382 days.
A massive gap-up opening is supported by strong volumes indicating a new trend has begun. A long-term consolidation breakout with a gap is considered a powerful bullish indicator, suggesting that the stock is now in a strong momentum phase. The breakout is fuelled by high volumes, indicating strong buying interest and accumulation, multiplying the conviction that the momentum could potentially continue for the next few weeks, driving the stock to new highs.
Mahindra & Mahindra: Hitting New Highs with Sector-Leading Strength
In the current auto rally, M&M has been a stellar performer, hitting a new all-time high of Rs 3,432. The stock’s breakout from multiple previous highs on the daily chart, backed by significant volumes, multiplies the conviction that the stock price may continue its upward trajectory.
M&M Daily Chart

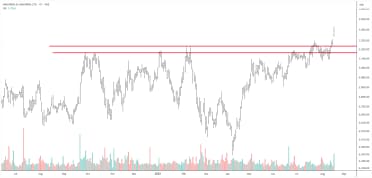
Furthermore, M&M has been outperforming the Nifty Auto Index for the last few months. The relative strength suggests that the stock is a market leader within its sector and is likely to continue its outperformance in the coming weeks.
TVS Motors: A Classic Bullish Pattern Signals the Next Leg Up
TVS Motors Daily Chart

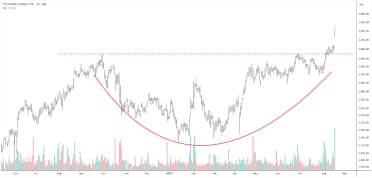
On the daily chart, the stock price of TVS Motors has formed a rounding bottom pattern signalling a gradual shift from a bearish to a bullish trend. The stock successfully broke out in early August followed by a bullish momentum with volumes suggesting the potential continuation of the current trend, making TVS Motors a stock to watch out for.
Is This Auto Rally Just Getting Started?
To sum up, the strong trend on the charts of Maruti Suzuki, Mahindra & Mahindra, and TVS Motors suggests that this rally is not just a knee-jerk reaction but has the potential to be continuing its bullish momentum in the coming weeks.
Disclaimer
Note: The purpose of this article is only to share interesting charts, data points and thought-provoking opinions. It is NOT a recommendation. If you wish to consider an investment, you are strongly advised to consult your advisor. This article is strictly for educative purposes only.
Kiran Jani has over 15 years of experience as a trader and technical analyst in India’s financial markets. He is a well-known face on the business channels as Market Experts and has worked with Asit C Mehta, Kotak Commodities, and Axis Securities. Presently, he is Head of the Technical and Derivative Research Desk at Jainam Broking Limited.
Disclosure: The writer and his dependents do not hold the stocks discussed here. However, clients of Jainam Broking Limited may or may not own these securities.
The website managers, its employee(s), and contributors/writers/authors of articles have or may have an outstanding buy or sell position or holding in the securities, options on securities or other related investments of issuers and/or companies discussed therein. The content of the articles and the interpretation of data are solely the personal views of the contributors/ writers/authors. Investors must make their own investment decisions based on their specific objectives and resources, and only after consulting such independent advisors if necessary.


