


Active management is hard, and it is becoming increasingly difficult for active managers to generate alpha. Investment decision-makers inevitably encounter the strategy paradox, where the behaviours and traits that lead to success can also lead to failure. When everyone adopts identical best practices, will everyone who does this succeed? What role does luck have to play? This is where performance attribution comes in handy. Not just for bringing clarity to distinguishing skill from luck but also for improving the investment decision-making process for all stakeholders. This is important for active managers who want to demonstrate their skills to clients and investors, as well as for advisors and investors who want to make informed decisions about where to allocate their capital.
Performance attribution refers to a set of techniques that analysts use to explain why a portfolio’s performance differed from the benchmark. They help investors understand the robustness of the investment process, help fund managers explain away short-term variations, and help investors stick with a sound investment strategy. Some advisors use attribution, but the usage needs to scale widely.
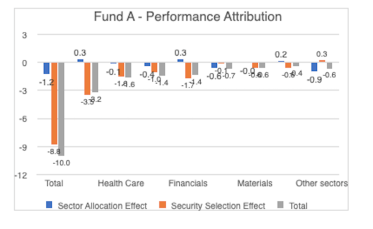
As an illustration, we consider two active funds within the large-cap category, Fund A and Fund B. We run a standard Brinson performance attribution analysis, which splits the active performance into two components – sector allocation effects, and active security selection within those sectors. For example, if energy companies outperformed Nifty during the period, and the manager had more allocation to energy stocks than Nifty, the outperformance is explained by allocation effects. However, if the same manager selects energy companies which underperformed the overall energy sector, the underperformance would be explained by security selection. We considered a one-year period ending December 2022, and compared the fund returns against a Nifty ETF as a proxy for the benchmark. A one-year time horizon might be appropriate for an ongoing fund performance review, while a longer time horizon might be appropriate for fund selection decisions.
Also Read: What to do if your Mutual Fund SIP has given less than Fixed Deposit return in 1 year?
During this period, fund A underperformed Nifty by a massive 10% points (-4.3% fund A vs +5.7% for the ETF). Of this, sector allocation contributed a negative 1.25%, most of which was accounted for by extremely low allocation of energy stocks compared to benchmark (4.5% weight in fund A vs 13.4% weight in Nifty). Security selection within sectors accounted for a massive -8.75% underperformance. For example, even though the manager over-weighted consumer staple companies on average, and consumer staples outperformed Nifty in 2022, within the sector, the manager excluded ITC (outperformer in 2022), and included Avenue Supermarts (underperformer in 2022) during the period. Security selections like these contributed to the underperformance of the fund.
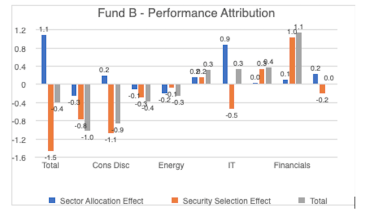
Fund B, on the other hand, underperformed by a much smaller margin of -0.4% (5.3% vs 5.7%). The sector allocation contributed a positive 1.1%, with an underweighting to IT sector contributing an impressive 0.9% to the active returns. Security selection contributed a negative 1.5%, however, with security selections within consumer discretionary contributing nearly -1.1% of underperformance.


Performance attribution provides a basis for not only understanding the investment process of a fund, but also have rich conversations between advisors and fund managers. For example, over longer periods, a comparison of active performance vs. manager assumptions would reveal if the outperformance was based on accurate forecasts or luck, and if the underperformance is based on imperfect analysis or bad luck. Such discussions help advisors and investors assess the strength of the process.
Also Read: Disadvantages of Mutual Funds for senior citizens and advantages – Explained
A discussion on performance attribution is incomplete without a discussion on benchmarks. An ideal benchmark is appropriate for the investment strategy of the fund. For example, if a fund had a strong value bias, it would reflect in over-weights in sectors like energy, materials, and financial services over time. It would be appropriate to evaluate it against a value benchmark which reflects the investment strategy. Another source of distortion might be risk – if a manager systematically selects riskier stocks within a category to maximise expected returns, then the category benchmark alone may not be appropriate. In this context, SEBI recommended a two-tiered benchmark in 2021, with a primary benchmark reflecting the category, and a secondary benchmark reflecting the investment strategy. Following SEBI’s guidance from 2021, asset managers and index providers could jointly work together to create these secondary benchmarks so the entire ecosystem, including investors benefits from these advances. We expect that the continuing rise of passive funds, the use of attribution techniques, and the adoption of secondary benchmarks would help advisors to become more discerning of active performance.
The Indian mutual fund industry has grown in size and sophistication over the past decade, aided by a series of reforms. As regulations move forward, it is important for market practices to continue evolving, not just to separate skill from luck but also to improve overall market efficiency.
The authors of this column are Sivananth Ramachandran, CFA, CIPM, Director of Capital Markets Policy, CFA Institute and Ravi Gautham, CFA, Director-elect at CFA Society India.
(Disclaimer: The opinions expressed in this column are that of the authors. The facts and opinions expressed here do not reflect the views of http://www.financialexpress.com)


