
Welcome to the latest edition of Dividend Hunter. Over the past few weeks, we have analyzed companies where strong cash flows could translate into consistent dividends going forward. In our previous edition, we covered a prominent logistics provider with 9 consecutive years of free cash flow and a 5.6% dividend yield.
Our focus today is on a prominent banking institution in India with a rich 118-year legacy. The bank manages more than 8,648 domestic branches and 80 overseas offices across 15 countries. With a global business asset of ₹30.8 lakh crore, the bank is one of India’s leading financial institutions.
The stock we focus on in this edition of Dividend Hunter is Bank of Baroda (BOB), a leading public-sector bank.
The bank’s growth outlook is supported by India’s robust macroeconomic fundamentals. According to Nomura, system wide bank credit surged 17.7% year-on-year as of 30 June 2026, marking the highest level in two years. Credit growth is expected to hover around 14.5-15.5% in FY27, according to CareEdge Ratings. This is good news for banks like Bank of Baroda.
The bank is undergoing digital transformation through platforms such as the BOB World application, thereby improving operational efficiency and customer connectivity. This aims to improve deposit mobilization and increase demand for the bank’s lending services. Regarding dividends, Bank of Baroda has consistently paid them.
Asset Quality Clean-up: How Record Earnings Resumed the Dividend Engine
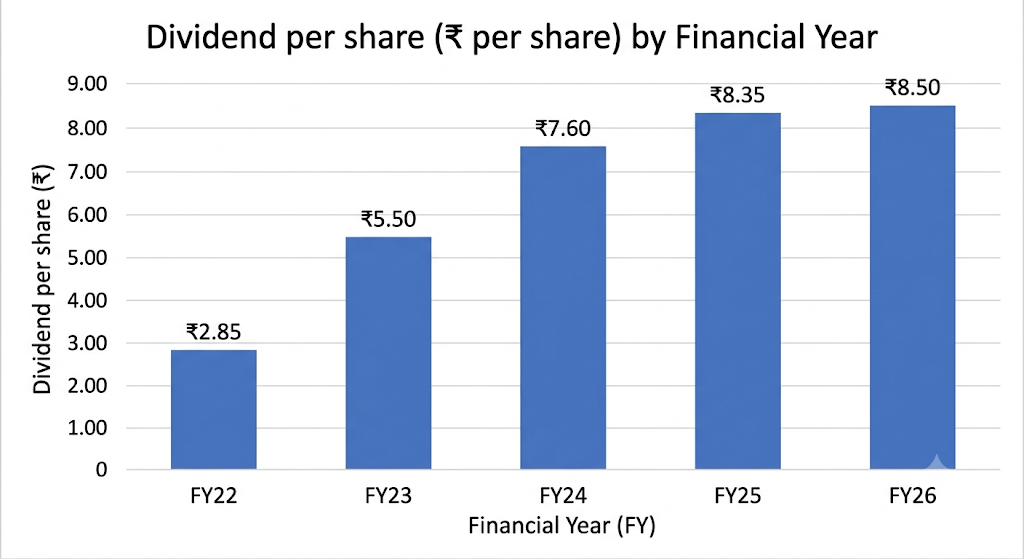
In fact, the bank has consistently increased its dividend payout since FY22, the first year after FY17. The bank didn’t pay any dividends between FY18 and FY22 due to balance sheet stress. BOB resumed dividends in FY22 at ₹2.85 per share and has paid almost 3 times higher dividends (₹8.5) in FY26.
Now, BOB is in a very strong position—asset quality is at its best in a decade, credit costs are low, and profits are rising, leading to increased free cash flow. This is happening at a time when credit growth is expected to remain strong. In FY26 alone, it reported a net profit of ₹20,070 crore and cash and cash equivalents of ₹1,60,823.1 crore.
But now the question is, can BOB sustain its dividend payments over the long term? This article attempts to answer that question by analysing the bank’s earnings, asset quality, and balance sheet strength.
Geographic Reach: Balancing High-Yield Rural Networks with Global Cross-Border Hubs
To understand Bank of Baroda’s scale and how it serves the public, it helps to look at how its physical branches, digital networks, and customer base are set up. The bank has organized its locations and services to reach people across different regions, income levels, and business needs.
The bank operates a large physical network within India. As of 31 March 2026, it has 8,648 domestic branches. This reflects a steady expansion, as the bank added 229 new branches during the year to improve its coverage in key locations. The bank also has 9,538 ATMs and 2,059 cash recycling machines for daily cash transactions.
The bank has expanded its branch network to ensure people in smaller towns and villages have access to banking services. The domestic branch network is divided as follows:
- Rural: 2,986 branches (making up 34.5% of the network).
- Semi-Urban: 2,260 branches (26.1%).
- Metro: 1,866 branches (21.6%).
- Urban: 1,536 branches (17.8%).
This distribution shows a clear focus on less populated areas. Together, the 5,246 branches in rural and semi-urban regions are specifically used to support agricultural lending and other priority-sector financial needs. To manage different types of customers effectively, the bank has dedicated specific branches to handle particular services.
Outside of India, the bank maintains an overseas presence to support cross-border trade and serve non-resident Indians. It operates 80 overseas offices located across 15 different countries. This international network includes 35 direct foreign branches and offices, as well as 45 branches operated by its 7 overseas subsidiaries.
Balance Sheet Expansion: Global Volumes Cross the ₹30 Lakh Crore Mark
Over the last 5 years, the company’s consolidated net profit grew at 73% CAGR, reaching ₹20,070 crore in FY26. This net profit is necessary for dividend payments, as PSU banks must transfer at least 25% of their profits to statutory reserves before declaring dividends. Also, dividends can only be paid out of the current financial year’s net profit.
In FY26, BOB recorded a strong financial performance.
The bank’s total global business surpassed the ₹30 lakh crore mark, reaching ₹30.8 lakh crore, up 13.9% year-on-year. Global gross advances expanded by 16.2% to ₹14.3 lakh crore, driven by a 14.5% growth in the domestic loan book and a 24.4% surge in international advances. The growth was broad-based, with retail loans growing by 17.9% and agriculture (20.7%).
Further, the retail segment also saw strong traction; gold loans surged by 98.0%, auto loans grew by 20.6%, and home loans rose by 14.6%.
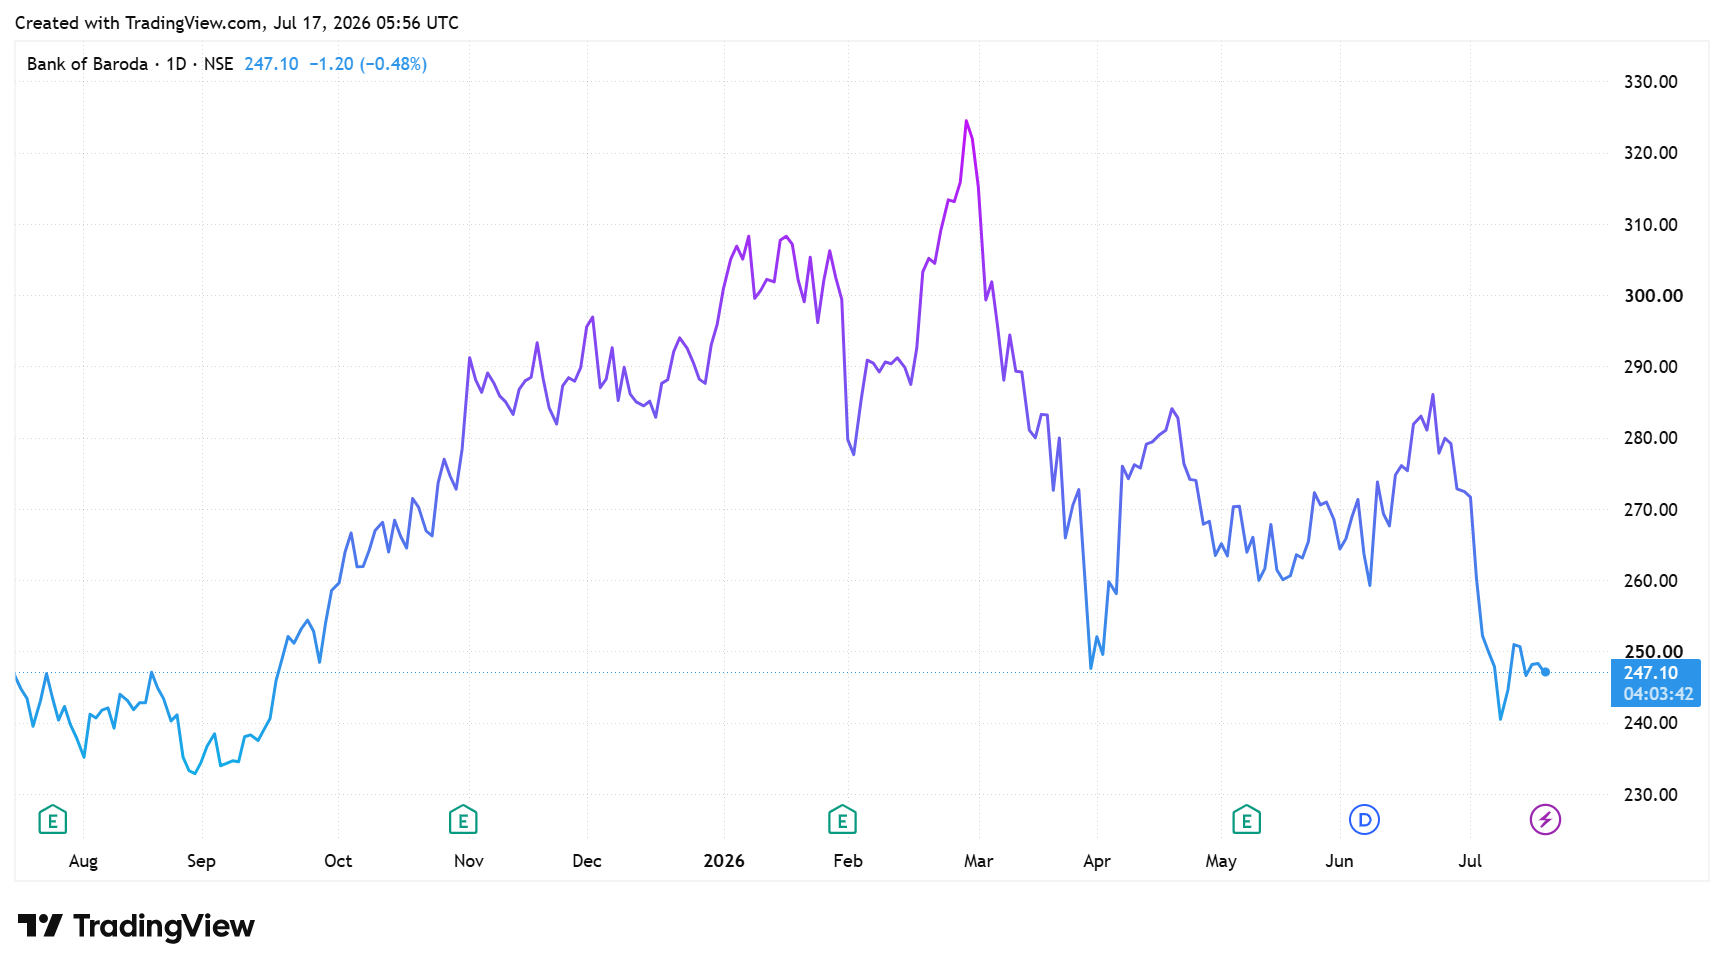
The bank’s market cap is ₹1,27,550 crore, as of 16 July 2026.

Core Profitability Metrics: Analyzing NII Margins Against Pristine NPA Levels
On the liabilities front, deposit mobilization grew strongly. Total global deposits increased by 12.0% year-on-year to ₹16.5 lakh crore. Of this, domestic deposits grew by 12.8% to ₹14.0 lakh crore. The bank maintained a favorable, low-cost deposit base, achieving a domestic CASA ratio of 38.90%.
Turning to profitability, BOB Net Interest Income (NII) grew by a modest 2.5% year-on-year to ₹47,682 crore in FY26. The domestic Net Interest Margin (NIM) stood at 3.0%. Operating profit remained robust at ₹32,259 crore. The Return on Assets (ROA) stood at around 1.06%, and the Return on Equity (ROE) at 15.4%.
This implies that the bank generates enough surplus cash to service dividend outgoes.
Asset quality also improved, reaching what management described as “pristine” levels. The Gross Non-Performing Asset (GNPA) ratio dropped by 37 bps to a multi-year low of 1.89%, while the NNPA plummeted by 13 bps to a mere 0.45%. Its provision coverage ratio also stood at 93.9%, providing coverage for any future asset quality stress.
Looking ahead to FY27, management has outlined optimistic yet prudent guidance. The bank targets a loan growth of 12% to 14% and a deposit growth of 10% to 12%. NIM is expected to remain between 2.75% and 2.95%, while credit costs are projected to remain below 0.60%.
Cash Flow Sustainability: Analyzing the ₹33,426 Crore Operational Runway
As dividends are paid out of actual liquid cash, the cash flow statement is the best measure of the bank’s ability to fund these distributions. The primary source of funds for dividend payments is cash generated by the bank’s core operations.
According to the consolidated cash flow statement, the bank generated a net cash inflow from its operating activities of ₹33,426.1 crore during FY26. This indicates that the bank’s business activities generate consistent, reliable cash flow.
In the same period, the actual cash outflow for dividends, which is recorded under financing activities, amounted to ₹4,318.1 crore. A direct comparison of these figures shows that the net cash generated internally from operations (₹33,426.1 crore) is adequate to cover the dividend obligations (₹4,318.1 crore).
The bank has also recommended a final dividend of ₹8.5 per share for FY26, which will result in a total proposed dividend outgo of ₹4,395.7 crore. To ensure it can comfortably meet these payouts, the bank maintains a healthy buffer of liquid funds. The company added ₹28,345.4 crore of cash and cash equivalents in FY26, taking the total to ₹1,60,823.1 crore.
This is what the bank uses to make the actual cash payouts to its shareholders. Having a large and growing pool of cash and cash equivalents means the bank has sufficient funds to pay the proposed dividends without needing to sell off its long-term assets or borrow additional capital.
Additionally, the bank’s average Liquidity Coverage Ratio is approximately 127%. This indicates that the bank holds sufficient liquid assets to manage its short-term cash outflows. This fund can easily fund both the dividend payout and business expansion.
Regarding its dividend per share, the company has recommended ₹8.5 per share for FY26. At the current share price of ₹245, the dividend yield is 3.5%. Prior to FY26, the company paid ₹8.35 per share for FY25, up from ₹7.6 in FY24, ₹5.5 in FY23 and ₹2.85 in FY22. The company currently pays only a final dividend once a financial year.

Regulatory Limits and Risks: Navigating the RBI Ceiling on Public Sector Banking Yields
Dividend payouts have ranged between 20% and 22% during FY22-26. This aligns with the government of India directives stating that PSU banks must pay a minimum of 20% of their paid-up capital or net profit, whichever is higher, as dividends. As such, a 20% payout serves as the base for its dividend distributions.
Further, there is also an upper ceiling.
On the upper end, the bank is strictly regulated by RBI guidelines, which state that the dividend payout ratio shall not exceed 40% of the net profit. For 40% payout, the bank must maintain a Capital-to-Risk Weighted Assets Ratio (CRAR) of 11% or more for three consecutive years and have zero NNPA.
However, if NNPA is greater than zero but less than 3%, the maximum allowed payout drops to 35%. With a CRAR over 15.8% and an NNPA under 3%, BOB falls into the category that allows a dividend payout of up to 35%.
If a bank’s CRAR and NPA metrics are weak, the allowed dividend payout limit could even drop to 25%, 15%, 10%, or even zero. However, these are legal boundaries. Ultimately, the board of directors aims to keep the payout at least at the required 20% floor. This also means that as profitability grows, the dividend payout will increase further, as seen post FY22.
On the risk side, a rise in NPA could lead to higher credit costs, ultimately weighing on the bank’s net profit and, in turn, the dividend payout.
Relative Valuations: Tracking the Multiple Compression Against Sector Peers
Valuation-wise, BOB trades at a Price-to-Book (P/B) multiple of 0.8x, in line with its 10-year historical median (0.8x) but at a discount to sector median (1.0x), and larger peers such as State Bank of India (1.6x) and Union Bank (0.9x).
The Dividend Hunter Verdict
In short, Bank of Baroda is well-positioned to sustain its regular dividend payments. The bank’s core lending and deposit activities generate steady, reliable cash flow, resulting in an operating profit of ₹32,259 crore and a record net profit of ₹20,070 crore for FY26.
This cash in books could allow the bank to easily cover its yearly dividend while continuing to service its existing deposits and borrowings. As long as its core operations remain stable, the bank’s liquidity (LCR of 127%), capital reserves (CRAR of 15.8%), and NNPA (0.45%) ensure that its dividend policy remains highly sustainable.
Further, the government’s mandate for public sector banks to pay dividends suggests that BOB could continue to reward shareholders, provided asset quality remains stable, and the bank continues to report healthy profits.
Dividend hunters should add this stock to their watchlist.
Disclaimer:
Note: Throughout this article, we have relied on data from http://www.Screener.in and the company’s investor presentation and conference call. Only in cases where the data were unavailable have we used an alternative, widely accepted source of information.
The purpose of this article is only to share interesting charts, data points, and thought-provoking opinions. It is NOT a recommendation. If you wish to consider an investment, you are strongly advised to consult your advisor. This article is strictly for educational purposes only.
About the Author: Madhvendra has been deeply immersed in the equity markets for over seven years, combining his passion for investing with his expertise in financial writing. With a knack for simplifying complex concepts, he enjoys sharing his honest perspectives on startups, listed Indian companies, and macroeconomic trends.
A dedicated reader and storyteller, Madhvendra thrives on uncovering insights that inspire his audience to deepen their understanding of the financial world.
Disclosure: The writer and his dependents do not hold the stocks discussed in this article.
The website managers, their employees (s), and contributors/writers/authors of articles have or may have an outstanding buy or sell position or holding in the securities, options on securities, or other related investments of issuers and/or companies discussed therein. The articles’ content and data interpretation are solely the personal views of the contributors/ writers/authors. Investors must make their own investment decisions based on their specific objectives, resources, and only after consulting such independent advisors as may be necessary.