
India’s solar power capacity has grown rapidly. It stood at 162.15 GW on 30 June 2026. This was up from 2.82 GW in 2013-14. The increase was nearly 57-fold. India is now the world’s third-largest solar market by installed capacity. Union Minister Pralhad Joshi shared these figures in a written reply to the Lok Sabha. But that was not all. He had more to share.
Domestic solar manufacturing has also expanded. India had around 42 GW of solar module capacity by June 2026. Solar cell capacity stood at 11.5 GW. Awards for another 48.3 GW have been issued under the PLI scheme. Investment under the scheme has reached around Rs 73,400 crore. The government has also sanctioned 56 solar parks. Their combined capacity is 39,461 MW. Of this, 18,919 MW has been commissioned.
Despite this growth story, listed solar stocks have corrected sharply in 2026. In February, the US Commerce Department imposed preliminary countervailing duties of up to 125.9% on solar imports from India, followed by preliminary anti-dumping duties in April. Since a meaningful share of revenue for some Indian manufacturers comes from US exports, the announcement triggered a sector-wide sell-off. This is an important reason valuations across the sector look cheap today.
With the sector growing rapidly and several solar stocks trading at lower valuations, it makes sense to look at India’s cheapest listed solar stocks. The companies are ranked using EV/EBITDA. This ratio includes debt and cash. It also compares valuation with operating earnings. This makes it useful for the capital-intensive solar sector. We began with a list of solar stocks. Companies below Rs 1,000 crore in market capitalisation were removed.
Companies with diversified businesses and limited exposure to solar energy were excluded. Companies with negative EBITDA over the last five years were also excluded. The remaining stocks were ranked from the lowest EV/EBITDA multiple to the highest. Companies listed less than a year were also excluded.
A low valuation alone does not make a stock attractive. Solar companies have different business models. Some generate power. Others manufacture equipment or execute projects. Their debt, margins and growth prospects can vary sharply. Investors must examine the reasons behind the discount.
#1 Vikram Solar: Can Expansion Help Close the Valuation Gap?
Incorporated in 2005, Vikram Solar manufactures solar PV modules and also provides engineering, procurement, and construction (EPC) and operation and maintenance (O&M) services.
Vikram Solar Financial Performance
| Metric | FY26 |
| Revenue growth | 40.0% YoY |
| EBITDA growth | 86.0% YoY |
| RoCE | 30.6% |
| RoE | 21.4% |
| EV/EBITDA | 6.6x |
| Peer median EV/EBITDA | 17.6x |
Vikram Solar ended FY26 with its strongest financial performance so far. Revenue rose 40% year-on-year (YoY) to Rs 4,802 crore. The increase came from higher sales volumes. Module sales grew 76% to 3.3 GW. Profit growth was sharper. Net profit rose 236% to Rs 470 crore. Higher production and better operating leverage supported the gains.
The company also improved its working-capital position. The cash conversion cycle fell from 82 days in FY25 to 44 days in FY26. Vikram Solar had no long-term debt at the end of the year. Working-capital net debt stood at Rs 64 crore.
15.5 GW Expansion Plan: Scaling Backward Integration to De-Risk Module Supply Chains
Growth will now depend on a large expansion programme. Module capacity stood at 9.5 GW at the end of FY26. It will increase to 15.5 GW after the new 6 GW plant is commissioned. The plant was scheduled to produce its first module in June 2026.
Backward integration is the next step. Vikram Solar is developing a 9 GW solar-cell plant. The company has received all critical approvals. The first cell is expected in December 2026. Phased commissioning is scheduled to continue until March 2027. This should increase backward integration to around 70%.
A further 3 GW of cell capacity is planned. This will take total cell capacity to 12 GW. The overall investment is estimated at Rs 5,400 crore. This is 10% higher than the earlier plan. The increase followed a change in machinery sourcing.
The company also plans to enter wafer and ingot manufacturing. Its board has approved the first 6 GW phase. The project will require around Rs 3,700 crore. Commissioning is planned for FY29. Another 6 GW phase is expected later.
Battery storage is another part of the expansion. The company aims to build 15 GWh of capacity by FY30. A 5 GWh cell-to-pack facility is scheduled for March 2027. The first 7.5 GWh battery-cell facility is planned for FY29. Vikram Solar has already secured a 100 MWh order.
The order book stood at 8.2 GW in March 2026. Around 87% came from the domestic market. However, some orders face uncertainty. A 0.6 GW US project was cancelled after it became unviable. Exports from India to the US have also fallen sharply. The company is now exploring other markets like Europe, Australia and the Middle East.
Execution will be the main test. The expansion requires large investments across modules, cells, wafers and batteries. Delays could affect asset utilisation and returns. Changes in technology, raw-material costs and solar policies also remain risks. Still, the company reported a return on capital employed (RoCE) of 30.6% and a return on equity (RoE) of 21.4%.
6.6x EV/EBITDA and 30.6% RoCE: Why Expansion Risks Drive a 60% Peer Valuation Discount
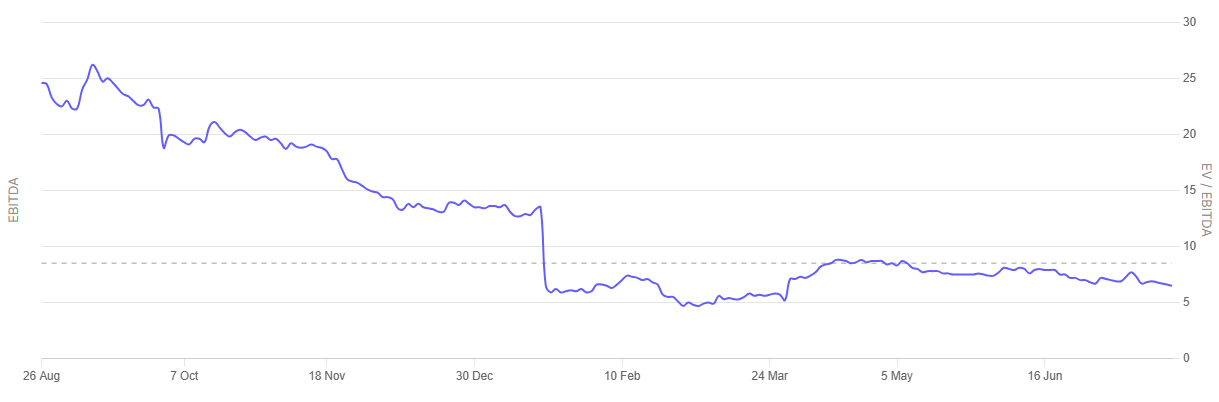
Vikram Solar trades at 6.6 times EV/EBITDA. This is below its median of 8.5 times since listing in August 2025. It is also lower than the peer median of 17.3 times. The discount may reflect expansion risks and uncertainty in export markets. Timely commissioning and stable margins could help narrow the valuation gap.
Below is the EV/EBITDA chart of Vikram Solar since listing.
Vikram Solar EV/EBITDA Chart Since Listing

#2 Insolation Energy: Growth Rises, but Cash Flow Remains Under Pressure
Incorporated in 2015, Insolation Energy is engaged in the business of manufacturing solar panels and modules of high efficiency of various sizes. The company’s 200 MW SPV Module manufacturing unit is located in Jaipur, spread over more than 60,000 square feet area with the latest machinery.
Insolation Energy Financial Performance
| Metric | FY26 |
| Revenue growth | 61.0% YoY |
| EBITDA growth | 79.0% YoY |
| RoCE | 22.2% |
| RoE | 28.2% |
| EV/EBITDA | 9.6x |
| Peer median EV/EBITDA | 9.7x |
Insolation Energy reported strong growth in FY26. Revenue from operations rose 61% YoY to Rs 2,146 crore. Higher production and stronger demand supported the increase.
Profit growth was also firm. EBITDA increased 79% to Rs 305 crore. The EBITDA margin improved to 14% from 13%. Net profit rose 59% to Rs 201 crore. The net profit margin stood at 9.3%.
The company now has 5.5 GW of solar module capacity. It also has an order book of about 1.6-1.8 GW for the current year. Nearly half of its available capacity is booked. Its distribution network includes more than 700 channel partners and over 25,000 customers.
Rs 2,500 Crore FY27 Capex: Funding TOPCon Cell Expansion Amid Leverage Pressures
Insolation is now moving into solar cell manufacturing. It is setting up a 4.5 GW TOPCon cell plant at Narmadapuram. Commissioning is targeted during the second half of FY27. The ramp-up will take time. Management expects utilisation to reach 60-70% in the two quarters after commissioning.
An aluminium frame facility is also expected to start operations in the first quarter of FY27. These projects should reduce dependence on external suppliers. They could also improve control over costs and product availability.
The next stage may include a 4.5 GW wafer and ingot plant. Insolation has secured 70,000 square metres of land at Narmadapuram. A detailed project report is being prepared. The estimated investment is Rs 1,000-1,200 crore. However, the final plan has not been approved.
The company is also building a solar power portfolio under the KUSUM programme. It plans to reach about 400 MW by FY27. Around 38-40 MW has been commissioned so far. The remaining capacity is under development. Management expects power sales to generate about Rs 135 crore in FY27.
There is no major overseas expansion plan at present. Management does not see exports to Europe or Africa as commercially attractive. The immediate focus remains on the domestic market and backward integration.
The expansion carries clear financial risks. FY27 capital spending could reach Rs 2,500 crore. This includes Rs 1,500 crore for the cell plant and Rs 1,000 crore for KUSUM projects. Borrowings rose from Rs 108 crore to Rs 835 crore during FY26.
Debt could peak at about Rs 1,500 crore in FY27. Free cash flow is negative. Trade receivables also increased 156% to Rs 280 crore. These trends point to weaker cash conversion and higher funding needs. Module pricing pressure and execution delays are other risks.
9.6x EV/EBITDA and 28.2% RoE: Why Rising Debt and Negative Cash Flow Keep Multiples Grounded
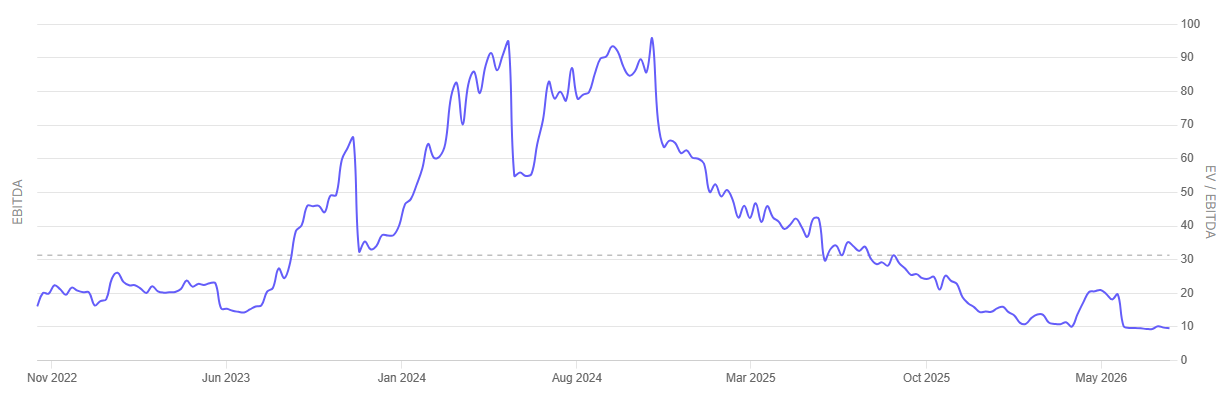
Insolation has a return on capital employed of 22.2%. Its return on equity is 28.2%. The stock trades at an EV/EBITDA multiple of 9.6 times. This is far below its median of 31.3 times since listing in November 2022. However, it is close to the peer median of 9.7 times.
The valuation discount to its own history may reflect rising debt, negative cash flow and project execution risk. On peer comparison, however, the stock is fairly valued rather than deeply cheap.
Below is the EV/EBITDA chart of Insolation Energy since listing.
Insolation Energy EV/EBITDA Chart Since Listing

#3 Waaree Energies: Expansion Drive Raises the Execution Stakes
Incorporated in December 1990, Waaree Energies is an Indian manufacturer of solar PV modules with an aggregate installed capacity of 12 GW. It has five solar module manufacturing facilities in India, with international presence.
Waaree Energies Financial Performance
| Metric | FY26 |
| Revenue growth | 83.7% YoY |
| EBITDA growth | 117.0% YoY |
| RoCE | 38.8% |
| RoE | 32.7% |
| EV/EBITDA | 11.2x |
| Peer median EV/EBITDA | 17.4x |
Waaree Energies reported strong growth in FY26. Revenue from operations rose 83.7% YoY to Rs 26,537 crore. Higher module sales and production supported the increase. Revenue from the retail business rose 84% to Rs 5,515 crore. Net profit rose 101% to Rs 3,884 crore. Module production increased 77% to 12.6 GW. The company sold about 12 GW during the year.
Waaree now has module manufacturing capacity of about 26 GW. Its cell capacity stands at 5.4 GW. The order book was around Rs 53,000 crore at the end of FY26. This was up from Rs 47,000 crore a year earlier. Overseas orders account for about 65-70% of the order book. They will be executed over the next three to four years.
Rs 30,000 Crore Multi-Sector Drive: Navigating Complexities Beyond Module Manufacturing
The company has planned investments of nearly Rs 30,000 crore across several businesses. An additional 3 GW module facility has been commissioned at Samakhiali in Gujarat. A further 10 GW of cell capacity is expected to start in the second half of FY27. This would take total cell capacity to about 15.4 GW.
Construction has started on a 10 GW ingot and wafer facility. The project will require about Rs 6,200 crore. Its completion has shifted from FY27 to FY28. The company increased the planned capacity from 6 GW to 10 GW. A change in the project location also affected the schedule.
Waaree is expanding beyond solar modules. It plans to build 20 GWh of battery capacity. It is also adding inverter, transformer and green hydrogen equipment capacity. The board has approved Rs 3,900 crore for a 2,500-tonne-per-day solar glass plant. Production is expected within two years. These investments can reduce dependence on suppliers. However, they also increase the scale and complexity of execution.
The company is strengthening its overseas supply chain. It acquired a strategic stake in an Oman-based polysilicon producer. Its US module plant has reached 1.6 GW. Capacity is expected to rise to 4.2 GW within six months. Local production should reduce exposure to US import duties. Still, changes in tariffs and sourcing rules remain important risks.
The expansion comes with financial pressure. Operating cash flow conversion fell to about 27% in FY26. Management linked this to higher inventory after shipping disruptions. Q4 margins were also affected by higher silver, copper and freight costs. A lower share of overseas sales added to the pressure. Large capital commitments, project delays and volatile input prices may continue to weigh on the stock.
11.2x EV/EBITDA and 27% Cash Conversion: Why Execution Stakes Discount Market Leadership
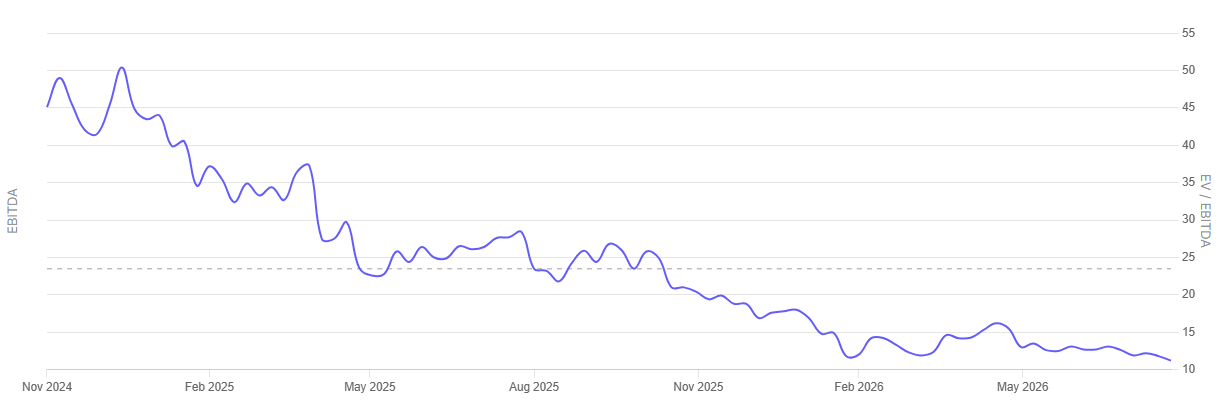
Waaree has an RoCE of 38.8% and a RoE of 32.7%. The stock trades at an EV/EBITDA multiple of 11.2 times. This is well below its median of 23.5 times since listing in November 2024. It is also below the peer median of 17.3 times. The discount may reflect weaker cash conversion, heavy capital spending and execution risk. The valuation appears inexpensive, but its sustainability will depend on timely commissioning and cash generation.
Below is the EV/EBITDA chart of Waaree Energies since listing.
Waaree Energies EV/EBITDA Chart Since Listing

Conclusion
Solar demand is growing, and these companies have large expansion plans. Most are moving beyond modules into cells, wafers, glass and energy storage. This may improve margins over time. But the investments are large, and the benefits will not come immediately.
This is where the risk lies. New plants must start on time and operate at healthy utilisation levels. Until then, debt and working capital may remain high. Module prices, raw material costs and changes in global trade rules can also affect earnings.
The lower valuations are attractive, but they should not be seen in isolation. Investors should watch cash flows, debt and the progress of new projects. Strong revenue and profit growth matter. However, the real test will be whether these companies can turn their expansion plans into steady returns without putting too much pressure on their balance sheets.
India’s Cheapest Solar Stocks
| Metric | Vikram Solar | Insolation Energy | Waaree Energies |
| EV/EBITDA | 6.6x | 9.6x | 11.2x |
| Peer median EV/EBITDA | 17.3x | 9.7x | 17.3x |
| FY26 revenue growth | 40.0% | 61.0% | 83.7% |
| FY26 EBITDA growth | 86.0% | 79.0% | 117.0% |
| RoCE | 30.6% | 22.2% | 38.8% |
| RoE | 21.4% | 28.2% | 32.7% |
You can track how these are progressing by adding stocks to your watchlist.
Disclaimer:
Note: We have relied on data from www.Screener.in throughout this article. Only in cases where the data was not available, have we used an alternate, but widely used and accepted source of information.
The purpose of this article is only to share interesting charts, data points and thought-provoking opinions. It is NOT a recommendation. If you wish to consider an investment, you are strongly advised to consult your advisor. This article is strictly for educative purposes only.
Ekta Sonecha Desai has a passion for writing and a deep interest in the equity markets. Combined with an analytical approach, she likes to deep dive into the world of companies, studying their performance, and uncovering insights that bring value to her readers.
Disclosure: The writer and her dependents do not hold the stocks discussed in this article.
The website managers, its employee(s), and contributors/writers/authors of articles have or may have an outstanding buy or sell position or holding in the securities, options on securities or other related investments of issuers and/or companies discussed therein. The content of the articles and the interpretation of data are solely the personal views of the contributors/ writers/authors. Investors must make their own investment decisions based on their specific objectives, resources and only after consulting such independent advisors as may be necessary.