


Transmission to bank lending rates has indeed accelerated in recent months. Yet, a perception has persisted that the extent of transmission consistent with the steep cuts in the policy repo rate, abundant liquidity, a series of measures by RBI and other policy authorities to revitalise credit, including provision of durable liquidity support, and introduction of market benchmarked lending rates in certain segments has not happened.
Meanwhile, bank credit growth had decelerated steadily to 6.3%, and credit off-take has remained quite moderate—and this has become a large factor in the growth slowdown. Designing appropriate policy responses for accelerating credit off-take hinges on the core question: Is this more a demand (weak corporate capex and retail consumption) or a supply (risk aversion in lending) problem? While the link between transmission, credit off-take, and risk aversion is complex and ambiguous at best, understanding the dynamics of transmission is crucial. One analytical approach might be to compare the current rate dynamics with similar rate cut cycles in the past.
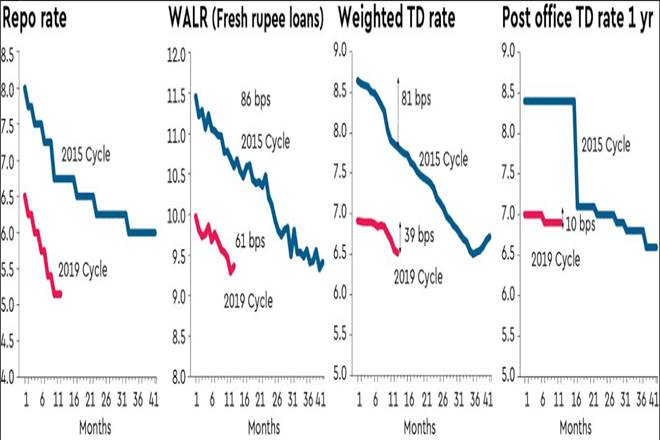

This article compares the current (2019) rate cycle with the 2015 one, which had a similar initial phase (we are now into the 13th month since the first rate cut in February 2019). The accompanying graphic shows the relative moves of the repo rate into the two cut cycles: Of the total 200 basis points (bps) repo cut in the 2015 cycle, the repo had been cut 125 bps by the 13th month. At the same point, in the 2019 cycle, the repo had been cut 135 bps.
However, at the corresponding points in these cycles, the Weighted Average Lending Rate (WALR) for Fresh Rupee Loans was down 86 bps in 2015 vs only 61 bps in 2019 (see graphic) despite the significantly high banking system liquidity surplus since the sixth month of the cycle in 2019, versus a liquidity deficit for the most part in 2015.
The proximate reason for this seemingly anomalous behaviour was a much steeper drop in Term Deposit (TD) rates in 2015 (81 bps) vs only 39 bps in 2019 (see graphic). The effect on cost of funds (CoF) for banks—and hence, lending rates—is also determined by the share of TDs in total deposits (since interest on current and savings deposits (CASA) doesn’t change that much). The faster transmission to WALR in 2015 due to the steeper drop in TD rates was also amplified by the higher share of TDs in deposits. The share of TDs in the first-four quarters of the 2015 cycle averaged about 65% vs about 59% in 2019. Overall, the changes in the CoF for banks in 2015 and 2019—and hence, lending rates—are consistent with the drop in TD rates and the shares of TDs in the respective periods. Hence, the focus of transmission analytics at this point needs to be on banks’ behaviour in attracting TDs.
While credit growth in 2019 had fallen from 14% to 6% over the cycle, it had remained steady around 10% in 2015. Yet, deposit growth rates in the two periods have remained mostly steady around 10%. Incremental deposits in 2019 have been significantly higher than incremental credit, unlike in 2015.
Why have TD rates not fallen more since June 2019, during the surplus liquidity environment? Part-answer might be competition for deposits, with TD rates kept high to attract deposits. For larger private banks, small finance banks and smaller private sector competitors are providing tough competition on deposit mobilisation, and hence, are still uncertain of the consequences of cutting rates aggressively. Efforts by private sector banks to get deposits due to continuing credit off-take is understandable, but would other banks, some constrained by Prompt Corrective Action (PCA) and low capital, still strive to attract deposits with low credit off-take? Protecting the low cost CASA franchises and (stickier) Retail TDs (RTDs) is logical, but why would higher cost bulk TDs still be sought? One hypothesis is that the share of RTDs in total TDs has risen since 2015, thereby, attenuating the drop in weighted average TD rates despite steep cuts in wholesale TD rates in 2019.
Sticky small savings deposit rates have also been blamed (and, might indeed be a problem for banks to get cheaper TDs), but actually SS rates had remained virtually flat in both cycles at the current stage (The large cuts in SS rates in the 2015 cycle only happened in the 16th month) (see graphic). There might also be the effect of the starting levels of the TD rates in the two cycles, with the higher gap between the 8.64% level and the 4% savings bank rate providing more room for lowering than the 2019 point of 6.9%.
In light of all these impediments, it is noteworthy that Fresh Loan WALR had still fallen 61 bps in 2018 vs 86 bps in 2015. This is not consistent with a “risk aversion” narrative.
One further influence on the differential transmission patterns in the two periods is probably the regulatory changes since 2015. For instance, the shift from the earlier Base Rate methodology for pricing loan to the Marginal Cost Lending Rate (MCLR) approach (from April 1, 2016), would have led to a closer alignment of lending rates to CoFs. This might have induced banks to manage the different interest rate reset periods of their asset and deposit portfolios, thereby, impacting WALRs. Strategic asset liability management considerations following introduction of Liquidity Coverage Ratio (LCR) norms might also have influenced rate behaviour. Although the arithmetic is hazy, investing the TD increments in SLR securities, despite negative carry costs, might be a net LCR benefit.
With expectations of continuing liquidity surpluses, bank lending rates will inevitably keep falling. Whether this boosts credit off-take remains to be seen.
The author is senior VP, Business and Economic Research, Axis Bank. Views are personal


