With India experiencing a decline in sales volume and a drop in average after-sales spend, automotive dealers are feeling the effects of a difficult year, according to the JD Power 2019 India Customer Service Index study, released this week.
The study finds a 10% drop in the average amount spent per service visit compared with 2018. On average, customers spend Rs 5,000 per service visit, compared with Rs 5,600 in 2018. The decline is greatest among after-sales customers who are 39 years or older, whose spend declined 17% year over year. The decline in service revenue is significant for dealers as 31% of their profits are generated from after-sales versus 25% from sales.
“Typically, dealers rely on service work to keep their businesses profitable especially during a downturn in new-vehicle sales,” said Kaustav Roy, director & country head for India, JD Power. “A drop in average service spend bodes negatively for overall dealer profitability. More than ever, dealers need to focus on delivering an excellent service experience to retain customers and encourage loyalty and advocacy.”
“For customers who rate their experience in the top quartile of satisfaction (929 points and above on a 1,000-point scale), 89% are more likely to return for post-warranty service work. Similarly, 90% of customers in the top quartile will recommend the service centre to a friend or relative,” the study noted.
Key findings
Reluctance to go digital: After-sales customers rarely use digital channels to set appointments despite indicating higher satisfaction when used;
Fewer customers stay at the dealership: More than one-fifth (21%) of customers stay at the service centre during their visit, a decline of 10 percentage points from 2018.
Rankings
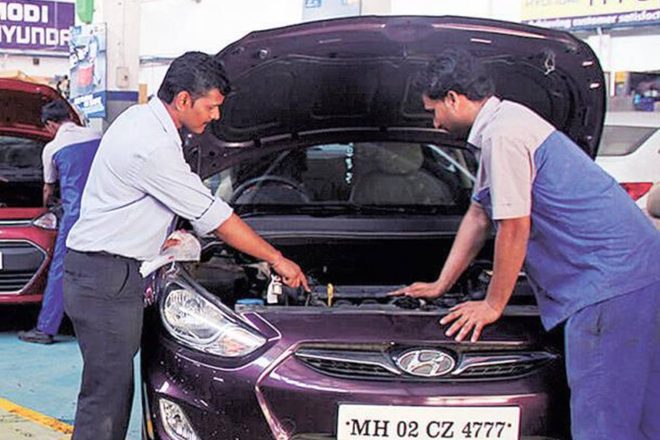
Hyundai ranks highest in overall service satisfaction with a score of 903. Tata (870) ranks second and Mahindra (863) ranks third.
The study is based on responses from 7,177 new-vehicle owners who purchased their vehicle between March 2016 and August 2018.