India is a rare bright spot amongst emerging markets. Having been battered during the 2013 ‘taper tantrum’, India has progressively benefited from better macroeconomic policy formation, slow, but nonetheless incremental structural-reform delivery and, above all, the collapse of global commodity prices, especially international oil prices. The latter, in particular, has helped transform India’s external vulnerability, seeing it migrate decisively out of the emerging-market danger zone.
In turn, these intermeshing developments mean that India’s policy space at the margin is growing, not shrinking like most emerging markets. A cocktail of enhanced monetary-policy credibility thanks to the adoption of a formal inflation-targeting regime, lower international commodity prices (both energy and food) and government action to improve food supply has pulled down CPI inflation sharply, creating space for a deeper rate-cutting cycle than we (and the market) had initially expected. Lower oil prices are also crimping the government’s subsidy bill, allowing a much-needed reacceleration of government capital spending.
This is not to take an overly Panglossian view on India. The turn in the capex cycle is still tentative, a number of key indicators, such as credit growth, still signal relatively sluggish growth momentum and the rebasing of India’s national accounts, which has lifted GDP growth, continues to be taken with at least a pinch of salt. The National Democratic Alliance (NDA) government’s lack of a majority in the upper house is also preventing a faster tempo of structural reform in key areas such as broadening the tax base and improving land acquisition.
Still, there can be little doubt that the Indian economy is increasingly on an upward arc and, as the Chinese economy continues to slow, it is quietly assuming the mantle of fastest-growing major emerging market economy, concerns about its revised national accounts notwithstanding. One statistic encapsulates this gradual ‘changing of the guard’. After years in the doldrums, India’s industrial-production growth has accelerated progressively over the last six months and, thanks to the simultaneous step-by-step weakening of China’s industrial sector over the same period, is now—unusually—outstripping the latter. Indian Q3 GDP will not be released until late November, but it, too, is expected to outpace China’s ‘official’ 6.9% y/y growth in Q3.
Critically, this crossing of the streams looks set to be a structural, largely permanent phenomenon rather than a temporary cyclical development. As China wrestles with souring demographics and rebalances towards lower-productivity service-sector activity, potential GDP growth is slowing. By contrast, India’s buoyant demographics, falling dependency ratio and need to reverse the slide seen its capex share this decade add up to rising, not falling, trend GDP growth. Indeed, the IMF not only expects India to have the highest trend growth among major emerging markets in 2016, but, at about 7.5%, India’s potential growth is around a full percentage point above the second-placed Philippines and a 1.5 percentage-points above China’s.
Those hoping that a more buoyant India can effectively replace the ailing Chinese economy as a new global growth locomotive are likely to be disappointed, however, at least for the foreseeable future. Key are the two ‘S’s—size and structure. In terms of size, China’s economy dwarfs India’s. In terms of gauging the relevant impact on global demand, GDP at market prices in dollar terms is the relevant metric, rather than abstruse and highly arbitrary purchasing power parity-adjusted GDP estimates. Although India is fast approaching China in terms of absolute population, its much lower living standards (partly a function of its much later economic ‘take off’) mean its economy is around five times smaller than China’s. At market prices, Chinese GDP was a little more than $10 trillion in 2014, while India’s was just over $2 trillion.
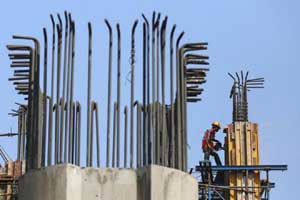
As has been well documented, the structure of the Chinese and Indian economies is also very different. India’s service sector is proportionately much larger than China’s (about 55% of GDP vs around 45%), while its investment and industrial-production shares are much lower. While China’s post-global-financial-crisis GDP growth has been sustained by unprecedented growth in real-estate and infrastructure investment, the latter, particularly in India, has languished for many years due to fiscal strains and difficulties associated with land acquisition. Infrastructure investment has surged to more than 20% of Chinese GDP, but it is still in the single digits in India. Given the respective sizes of the two economies, China’s annual spending on infrastructure in dollar terms is more than ten times India’s.
This enormous discrepancy is reflected in the economies’ respective shares of global industrial production. While China’s share has almost doubled, remarkably, since the global financial crisis, rising to more than 20%, India’s has been relatively constant at around 2.5%, almost ten times lower. This 10:1 relativity in terms of industrial size is also typically reflected in terms of commodity demand. For most key industrial commodities, China is not just the dominant player, but now accounts for the majority of demand. World Bank data, for example, show that China now accounts for 50% or more of global demand for steel, coal and primary metals (aluminium, copper, lead, nickel, tin and zinc). India’s commodity demand has been about ten times smaller; it consumed around 80 million tonnes of steel in 2014 versus China’s 800 million tonnes. Accordingly, while India may be slowly usurping China in terms of overall GDP and industrial production growth, it cannot realistically act as a meaningful offset to peaking Chinese demand for industrial commodities as its epic investment cycle inevitably flattens out.
The author is chief economist, Emerging Markets and Asia ex Japan, BNP Paribas
