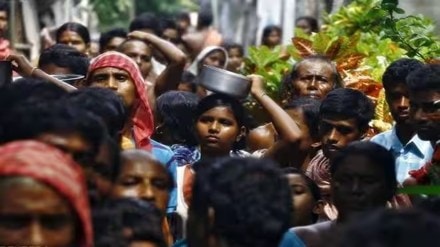
There are multiple ways to define and measure poverty. Conventionally, poverty has been defined as percentage of population below a poverty line, the so-called head-count ratio. The current official poverty line is still the Tendulkar one. The Rangarajan one wasn’t formally accepted. Since there aren’t any NSSO (National Sample Survey Office) surveys on consumption expenditure after 2011-12, we are stuck with the incongruous situation of no head-count ratios after 2011-12. Meanwhile, developmental economists have argued poverty is multi-dimensional. Hence, we transited through physical quality of life indicators and human development index (HDI), before zeroing in on the currently favoured MDPI (multi-dimensional poverty index). MDPI is more like a development index, based on three dimensions—health, education and living standards. Health (nutrition, child and adolescent mortality, maternal health) and education (years of schooling, school attendance) are important development objectives and influence future poverty. However, these should be on a somewhat different footing from living standards (cooking fuel, sanitation, drinking water, electricity, housing, assets, bank accounts). Living standards do reflect poverty. Inclusion of health and education makes the word “poverty” elastic. But when the poor have cried, many who are not Caesars have also wept. Therefore, we have this broad notion.
Following the UNDP’s global report, NITI Aayog recently brought out India’s MDPI report for 2023. In both cases, improvements are primarily driven by NFHS-5. UNDP’s report said 415 million people moved out of poverty between 2005-06 and 2019-21 and the incidence of poverty declined from 55.1% to 16.4%. With no consumption expenditure data after 2011-12, different people have tried to estimate head-count ratios in various ways, with varied assumptions. A modal value will be between 15% and 20%, though some outliers have a lower number. No matter how much sophistication one brings in, head-count versus MDPI, poverty numbers will be around 15% of the population. UNDP says the fastest declines have been in poorer states. But its report is for all of India, in the aggregate. The NITI report disaggregates. Poverty ratios declined from 24.85% in 2015-16 to 14.96% in 2019-21. (The slight difference in 2019-21 numbers between the two reports is because of minor differences in indicators.) Between those two end-points, an estimated 135.5 million Indians exited poverty—34.3 million of that was in UP alone. That’s a huge number and, extrapolated, has implications not only for India achieving the SDG target 1.2, but also for the world as a whole.
Many years ago, demographer Ashish Bose coined the acronym Bimaru, for then undivided Bihar, Madhya Pradesh, Rajasthan and Uttar Pradesh. Bimaru was a metaphor for much that was wrong with India. Understandably, India’s development, employment and poverty reduction are largely a function of what happens in these states, now divided. This is because of large populations as well as the large poverty base. In addition, poverty reductions are never linear. Sharper reductions occur when base poverty levels are high. Thereafter, reductions become more difficult and poverty numbers tend to be sticky. Poverty lines in advanced countries will indeed be different. Having said this, those numbers get stuck at around 10%. The Niti report tells us fastest reductions in poverty happened in UP, Bihar, MP, Odisha and Rajasthan. Bihar is now at 33.8%, MP at 20.6%, Odisha at 15.7% and Rajasthan at 15.3%. UP is at 22.9%, with a base of 37.7% in 2015-16, roughly similar to the base in MP. (Odisha and Rajasthan had lower bases in 2015-16.) Subject to the usual caveats about surveys like NFHS, these are remarkable improvements in four years. (NFHS-5 was right in the middle of Covid and both MP and UP are Phase-II States, with surveys in April 2021.)
What explains these improvements in UP? Depending on how poverty is measured, reductions can be a function of income (or consumption) growth, such as with HDI. But that’s not the MDPI design. MDPI is built around what Economic Survey calls basic necessities—Awas Yojana, Jal Jeevan, Swachh Bharat, Saubhagya, Ujjwala, Jan Dhan Yojana, Poshan, Ayushman Bharat, and Samagra Shiksha. These are essentially implemented by the states and it is better delivery in these that have led to such declines in poverty. If one counts the number of indicators under those three heads of health, education and living standards, the aggregate is 12. While UP registered improvements under all, especially on three, reductions in deprivation are remarkable. For cooking fuel, deprivation dropped from 68.85% to 52.92%. For sanitation, it dropped from 63.65% to 31.61%. For electricity, it dropped from 27.43% to 9.16%. Though the point about stickiness remains valid, the next big declines will be in nutrition, maternal health, cooking fuel, sanitation and housing, because the base levels of deprivation are still high. Within UP, there are variations between districts. Aspirational districts of Bahraich, Shravasti and Balrampur are still relatively high on deprivation. But there has been a metamorphosis in Chandauli, Chitrakoot and Fatehpur—again, relatively speaking. Perhaps there is a need to probe what clicked here. These weren’t “easy” districts and are also aspirational. MDPI is one kind of snapshot. Development has other dimensions too. In those too, Bimaru is breaking the shackles.
Th author is Chairman, EAC-PM
