
Betting on the Inflection: Why Ashish Kacholia is Chasing Operating Leverage in High-Risk Smallcaps
Most investors buy growth after everyone can see it. Ashish Kacholia tries to buy it just before. The man who set up Lucky Securities in 1995, and co-founded Hungama Digital with Rakesh Jhunjhunwala in 1999, hunts small companies at the point where losses turn into profits. Early calls like Atul Auto and Mayur Uniquoters built his reputation. A disclosed portfolio of 48 stocks worth over Rs 2,860 cr per Trendlyne keeps it alive.
Two of the smaller names from these 48 have caught the attention of many investors, thanks to what we can call a deadly duo – Low Debt + Solid Profit. One is a Mumbai menswear company whose stock has dropped around 40% from its peak, even as profits climbed every quarter. The other is an engineering firm, an SME listed on NSE Emerge that builds city parks out of reclaimed waste, where Kacholia did something more telling than holding. He bought more.
Both have multiplied sales at a pace most large caps could be envious of, even if on a small base. Time to dive in and see what makes the engines work at these companies.
#1 Thomas Scott (India): The 64% Growth Engine
Incorporated in 2010 as an offshoot of Bang Overseas, Thomas Scott (India) makes and trades men’s shirts, formal wear and casual wear under brands like Thomas Scott, Hammersmith, Bang & Scott and Italian Gold. It began as a conventional retail chain with around 31 outlets. Over the past three years, it has rebuilt itself around online fashion, selling licensed and owned brands through e-commerce platforms alongside its stores. The strategy sounds fashionable. The numbers say it is working.
Kacholia entered in the March 2025 quarter with 307,539 shares, a 2.43% stake worth about Rs 9.5 cr. Per the June 2026 filings, he holds exactly 307,539 shares, now 2.10% of a larger equity base after fresh share issues. The company has a current market cap of Rs 450 cr and Kacholia’s holding is worth Rs 9.4 cr currently.
From Seven Loss Years to a 64% Sales Compounding Machine
Thomas Scott lost money in most years between FY15 and FY21, stuck near Rs 20 cr of sales. Then the flywheel caught.
| Financial Year | FY21 | FY22 | FY23 | FY24 | FY25 | FY26 | 5Y CAGR |
| Sales (Rs cr) | 21 | 32 | 62 | 90 | 144 | 255 | 64% |
| EBITDA (Rs cr) | 1 | 1 | 5 | 13 | 19 | 33 | NM |
| Net Profit (Rs cr) | -0.1 | 1 | 3 | 10 | 13 | 19 | NM |
EBITDA here refers to operating profit before other income. FY21 operating profit was barely Rs 1 cr and the year ended in a small loss, so 5-year growth rates for EBITDA and net profit would be meaningless off that base. Both are marked NM (Not Meaningful). Sales, off a clean base, compounded at 64% a year.
Margins tell the second half. Operating margin climbed from 4% in FY21 to around 13% in FY26. The FY26 quarters show the momentum: sales of Rs 54 cr, Rs 57 cr, Rs 66 cr and Rs 78 cr in the March 2026 quarter, up 63% on the year, with net profit at Rs 6 cr. That is eight straight quarters of year-on-year growth in sales and profit. FY26 return on capital employed stood at 20.5%, return on equity at 16.7%.
The Valuation Reality: Does a 40% Drawdown Signal a Buying Opportunity?
The share price of Thomas Scott was around Rs 18 in July 2021 and as of closing in 24July 2026, it was Rs 307, which is a jump of over 1,600% in 5 years. Rs 1 lakh invested in the stock 5 years ago would have been over Rs 17 lakhs today.

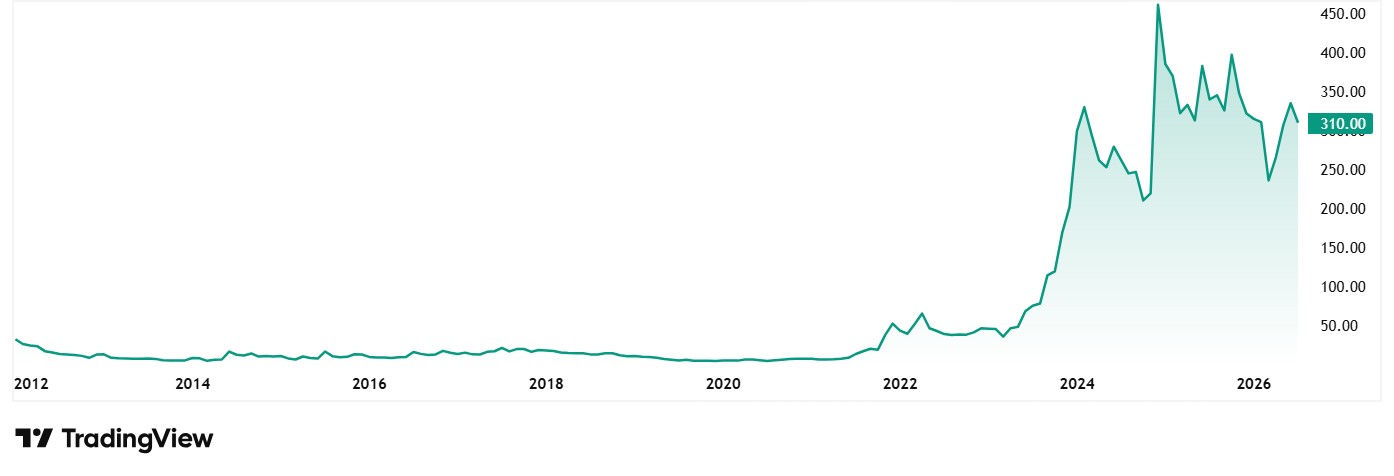
However, at the current price, the stock is trading at a discount of close to 40% from its all-time high price of Rs 509.
Regarding valuations, the company’s share is trading at a PE of 21x against the current industry median of 22x. The 10-year median PE for the company is 23x while the industry median for the same period is 25x.
But it must be noted that the company was loss making for most of the last decade, so a 10-year median PE must be looked at with that lens. Meaningful earnings began only in FY22, a record of barely five years. On that short record, 21x earnings for 64% sales growth does not look demanding. Whether the growth holds, is the whole question, and the market is clearly split.
The register offers two clues. Shareholder count jumped from 4,526 in June 2023 to 10,191 by March 2026, so retail has found the story. Domestic institutions own 2.45%, up from nothing three years ago. And promoter holding, at 52.32% in March 2026, actually inched up during the quarter.
The Catch: Cash Is Leaving as Fast as Profit Arrives
Borrowings jumped from Rs 13 cr to Rs 46 cr in FY26. Operating cash flow has been negative four straight years, at Rs -27 cr in FY26, because inventory sits for 249 days and customers take 123 days to pay. Fashion retail at this speed eats cash, and Thomas Scott has fed it with fresh equity and debt. That is why promoter holding slid from 69.64% in June 2023 to 52.32%, diluted by the very share issues that paid for growth. No dividend has ever been paid. The profit on paper is real. So is the cash consumed to produce it.
#2 Z-Tech (India): The Waste-to-Wealth SME That Triggered Fresh Insider Buying
Incorporated in 1994, Z-Tech (India) ,Delhi based firm, runs three verticals. It designs, builds and operates theme-based city parks, six of them created from over 5,000 tonnes of reclaimed waste. It treats industrial wastewater with its proprietary GEIST technology, over 517 million gallons recycled so far. And it does specialised geotechnical work, the quiet science of slope stabilisation and ground improvement.
With a current market cap of Rs 763 cr, the company has a recent and visible order flow. In June 2026, the company won the Luv-Kush park project in Ayodhya, worth an estimated Rs 17.41 cr with a 20-year operations and maintenance contract, per its exchange filing.
Here is the interesting bit. While Kacholia held Thomas Scott through its fall, he added to Z-Tech, from 3.5% in December 2025 to 3.7% in June 2026, A holding worth Rs 28 cr today. Buying more of a thinly traded SME stock below its highs is as direct a signal of conviction as filings allow.
The Growth Mirage: Adjusting Z-Tech’s 105% Profit Spikes for Base Effects
| Financial Year | FY21 | FY22 | FY23 | FY24 | FY25 | FY26 | 5Y CAGR |
| Sales (Rs cr) | 23 | 31 | 26 | 67 | 94 | 156 | 47% |
| EBITDA (Rs cr) | 1 | 0 | 3 | 12 | 28 | 43 | 112% |
| Net Profit (Rs cr) | 1 | 0 | 2 | 8 | 20 | 36 | 105% |
EBITDA once again refers to operating profit before other income, on standalone numbers, since the consolidated FY26 set had not fully reflected at the time of writing. It must be noted that the EBITDA and profit began from Rs 1 cr or less in FY21, so their 5-year growth rates while big figures, do not paint the real picture.
Operating margin expanded from 3% to 28% as the mix shifted to higher value park and water projects. The FY26 quarters ran Rs 20 cr, Rs 34 cr, Rs 42 cr and Rs 59 cr in sales.
Two footnotes belong in plain sight. FY26 profit includes other income of Rs 6 cr against profit before tax of Rs 45 cr, and the March 2026 quarter carried a low tax rate of 7%. Adjust for both, and the core engine is still strong, just less shiny than the headline Rs 36 cr suggests.
A 24x Multiple with Only Two Years of Listed History
The share price of Z-Tech was around Rs 115 when listed in June 2024 and as of closing on 24 July 2026 it was Rs 524, which is a jump of over 350% in 2 years. Rs 1 lakh invested in the stock at listing, would have been over Rs 4.5 lakhs today.

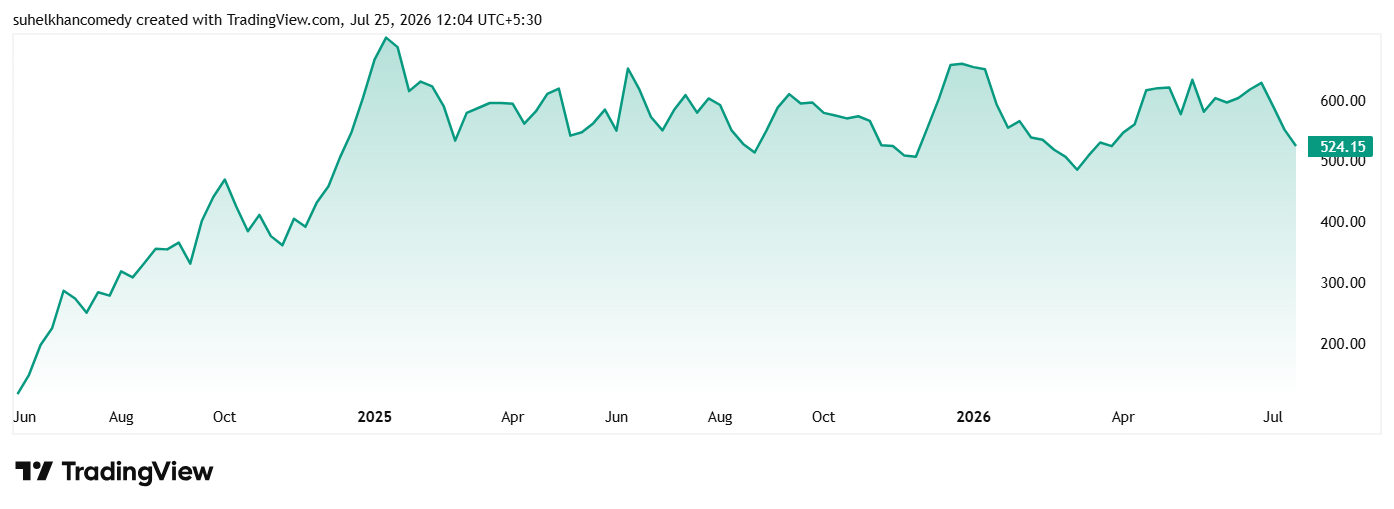
At the current price, the stock is trading at a discount of about 28% from its all-time high of Rs 731.
About the valuations, the company’s share is trading at a PE of 21x against the current Industry median of 25x. The company listed on the NSE Emerge platform only in June 2024, so its entire valuation history covers barely two years. That cuts both ways. The multiple looks reasonable for the growth, but there is no long cycle of evidence behind it, no bear market survived.
Promoter holding stood at 53.54% with zero pledged shares, per the June 2026 disclosure. Foreign investors lifted their stake from under 1% to 4.47% in a year, and warrant conversions in July 2026 brought in another Rs 7.7 cr.
Please note that SME platform stocks trade in large minimum lots, with thin volumes and wide price swings. Exiting in a falling market can be genuinely difficult, and disclosure norms are lighter than for mainboard companies. A 3.7% stake for an investor with a Rs 2,850 cr book is a measured bet. The same position sized carelessly in a retail portfolio is a very different animal. Only investors who understand these risks should study such stocks, let alone buy them.
The Final Checklist: Cash Flows Over Paper Profits
When you see both the stocks together, the pattern is almost visible. Neither is the safe, cash rich compounder that value investors look for. Both are profit inflection stories, growing sales at 47% to 64% a year while burning cash to fund it. And both are cheaper than they were, one dramatically so.
What Kacholia appears to be betting on is that operating leverage wins the race against working capital. If margins hold and collections improve, today’s prices, one 40% off its high and the other 28%, may look like the discount phase of two long compounding curves.
If cash flows stay negative, the story will be completely different. His filings show patience on one stock and fresh buying on the other. For retail investors, the honest takeaway is not a tip. It is a checklist. Watch the cash flow statement as closely as the profit line, track debtor days each quarter, and treat the SME tag with the respect it demands. Add these stocks to a watchlist to keep an eye on them.
Disclaimer:
Note: We have relied on data from http://www.Screener.in and http://www.trendlyne.com throughout this article. Only in cases where the data was not available, have we used an alternate, but widely used and accepted source of information.
The purpose of this article is only to share interesting charts, data points and thought-provoking opinions. It is NOT a recommendation. If you wish to consider an investment, you are strongly advised to consult your advisor. This article is strictly for educative purposes only.
Suhel Khan has been a passionate follower of the markets for over a decade. During this period, he was an integral part of a leading Equity Research organisation based in Mumbai as the Head of Sales & Marketing. Presently, he is spending most of his time dissecting the investments and strategies of the Super Investors of India.
Disclosure: The writer and his dependents do not hold the stocks discussed in this article. The website managers, its employee(s), and contributors/writers/authors of articles have or may have an outstanding buy or sell position or holding in the securities, options on securities or other related investments of issuers and/or companies discussed therein.