


For any business, one area stands out irrespective of what line of business they are into. SALES! If a company can sell and has pricing power, that can be a lethal combination. Bigger sales get bigger monies and, in the end, of course, bigger profits if companies use the money coming from sales wisely.
As per the exchange filings made for the quarter ending December 2024, two companies have recorded over 200x year-on-year grown in their sales number. Which means they saw over 200,000% jump in sales between December 2023 and December 2024. One would definitely wonder, how did they do it? For investors hunting for the next big thing, this is like potentially hitting the jackpot. But those crazy numbers also make you think: what’s really going on here, and can it last?
Is this a one-time thing or have these companies have found something special? Maybe a revolutionary product, perfect timing, or a brilliant strategy. Whatever it is, their stories show how fast things can change in business. But all that growth also brings some worries. Can they keep it up? Are they built to last, or is this just a flash in the pan?
Let us take a closer look at these 2 companies…
Websol Energy System Ltd (WESL)
With a market cap of Rs 4,963 cr, WESL is engaged in the business of manufacturing photovoltaic crystalline solar cells and related modules in India.
WESL specializes in the production of photovoltaic crystalline solar cells and related PV modules. The Company’s products are used in both commercial and industrial Solar Energy panels in India and internationally.
WESL’s sales have shown a whopping 28,784% YoY growth. Here is how it has looked in the last few quarters:
| Quarter | Dec-22 | Mar-23 | Jun-23 | Sep-23 | Dec-23 | Mar-24 | Jun-24 | Sep-24 | Dec-24 |
| Sales (In Cr) | 0 | 0 | 0 | 0 | 1 | 25 | 112 | 144 | 147 |
WESL’s revenue dropped FY23 due to the discontinuance of the 250 MW cell line as part of the process to graduate towards the new Mono PERC technology. For the same, production had to be discontinued to dismantle the old manufacturing equipment.
However, in early 2024 the company after the change had taken place, WESL started to sell commercially at capacity. The module line also started soon after.
The EBITDA (earnings before interest, taxes, depreciation and amortization) also has shown tremendous improvement in the last 2 years. And so did the Operating profits margin (OPM). Look at how it has improved over time:
| Quarter | Dec-22 | Mar-23 | Jun-23 | Sep-23 | Dec-23 | Mar-24 | Jun-24 | Sep-24 | Dec-24 |
| EBITDA (In Cr) | -5 | -1 | -1 | -1 | -2 | -3 | 44 | 63 | 68 |
| OPM % | -1627% | -1327% | -750% | -277% | -429% | -13% | 39% | 44% | 46% |
That is a turnaround which can make many companies jealous, and we cannot blame them.
Both the sales and the EBITDA also helped get the net profits back on track for WESL.
| Quarter | Dec-22 | Mar-23 | Jun-23 | Sep-23 | Dec-23 | Mar-24 | Jun-24 | Sep-24 | Dec-24 |
| Net Profit (in Cr) | -7 | -5 | -5 | -4 | -55 | -59 | 23 | 42 | 42 |
That seems almost like steering a sinking ship amidst a dangerous sea storm and getting it to shore with everything and everyone safe.
All of this put together pushed the share price of WESL as well. It has grown from Rs 92 in December 2022 its current price of Rs 1,131 (as on closing of 19th Feb 2025), which is a jump of a staggering 1,129% in just 2 years.

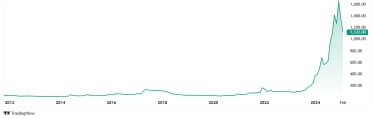
If one would have invested just Rs 100,000 in the company’ shares back in December 2022, it would have grown to over Rs 12,00,000 today!
Let us look at the valuations now. The company is currently trading at a price to earnings (PE) multiple of 99x which is a high number, considering the industry median is 49x. The median PE for the last 10 years for WESL is however a modest 11x, while the industry median for the same period is 33x.
In the company’s last annual report for FY24, the Chairman, Sohan Lal Agarwal said, “We are confident that the next three years will help us create a transformed business foundation”. He also added, “We intend to spread our new manufacturing capacities across two advanced technologies that could future-proof us for the foreseeable future”.
Inertia Steel Ltd (ISL)
Incorporated in 1984, Inertia Steel Ltd (ISL) is in the business of trading in Steel and Fabricated Items.
With a market cap of Rs 1,018 cr, ISL is engaged in the business as merchants, commission agents, brokers, buyers, sellers, importer, exporter, dealers, business agents, trading in iron and steel etc.
ISL’s sales have also shown a big turnaround in the last year recording a 20,620% YoY growth. Here is how it has looked in the last few quarters:
| Quarter | Dec-22 | Mar-23 | Jun-23 | Sep-23 | Dec-23 | Jun-24 | Sep-24 | Dec-24 |
| Sales (In Cr) | 0.06 | 0.09 | 0.09 | 0.10 | 0.10 | 0 | 16.88 | 20.72 |
Now this has happened due to a major change in the company’s business.
In August of 2024, the company altered its Memorandum of Association to include new business activities, positioning itself as a merchant, packer, trader, and dealer in various commodities and products.
Post that, it renamed itself to Banganga Paper Industries Limited and moved its registered office form Mumbai to Nashik. The sales jump is post this big change.
This change also affected the EBITDA and the OPM. Here is a look at how it changed…
| Quarter | Sep-23 | Dec-23 | Jun-24 | Sep-24 | Dec-24 |
| EBITDA (In Cr) | 0 | -0.02 | 0 | 1.12 | 1.61 |
| OPM % | 0% | -20% | 0% | 6.64% | 7.77% |
With the start of new business avenues, ISL now trades a vast range of goods, from raw materials like minerals and ores to manufactured products, including machinery, spares, and accessories.
ISL trades a vast array of goods, from textiles and agricultural products to electronics, building materials, and even precious metals, also acting as an Export House.
With all this adding up to the sales and EBITDA, the profits, which are still marginal, also showed signs of revival.
| Quarter | Sep-23 | Dec-23 | Jun-24 | Sep-24 | Dec-24 |
| Net Profit (in Cr) | 0 | -0.02 | 0 | 0.13 | 0.76 |
Now the absolute number might not be very big to catch attention, but with all the new business and the big jumps already seen after its start, the company shows a lot of promise.
Listed at the price of around Rs 8 in December 2022, the share price of the company (Banganga Paper Industries Ltd) is Rs 85 as on closing of February 20, 2025. This is an absolute growth of 963% in just a little over 2 years.

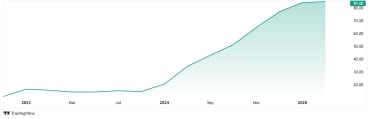
If one would have invested just Rs 100,000 in the company’ shares back in December 2022, it would have grown to over Rs 10,62,000 now.
The company has split the face value 1 time since Jan. 3, 2025. Banganga Paper Industries Ltd. had last split the face value of its shares from ₹10 to ₹1 in 2025.The share has been quoting on an ex-split basis from Jan. 3, 2025.
The company’s shares are currently trading at a negative PE as per screener.in, but the industry median when compared to peers is 42x.
The promoter holding has gone up from 6.43% in December 2023 to 71.09% as per the exchange filings made for the quarter ending December 2024. This was done via a preferential issue of share.
Are You Sold?
While these big YOY sales jumps can sound enticing and induce a fear of missing out in investors, it must also be noted that both companies currently exhibit high or negative PE ratios, suggesting potential overvaluation and warranting further scrutiny despite their impressive growth figures.
The companies have found the tipping point and are doing everything to ensure they keep up the pace and even push it further. The huge jump in the promoter holding also says that the promoters/founders have faith in the company’s future, and they have complete confidence in the path they have chosen.
How these two companies will perform and what it means for the shareholders will be an interesting journey to watch. So, adding these stocks one’s portfolio could be a good idea at this juncture.
Disclaimer:
Note: We have relied on data from http://www.Screener.in throughout this article. Only in cases where the data was not available, have we used an alternate, but widely used and accepted source of information.
The purpose of this article is only to share interesting charts, data points and thought-provoking opinions. It is NOT a recommendation. If you wish to consider an investment, you are strongly advised to consult your advisor. This article is strictly for educative purposes only.
Suhel Khan has been a passionate follower of the markets for over a decade. During this period, He was an integral part of a leading Equity Research organisation based in Mumbai as the Head of Sales & Marketing. Presently, he is spending most of his time dissecting the investments and strategies of the Super Investors of India.
Disclosure: The writer and his dependents do not hold the stocks discussed in this article.
The website managers, its employee(s), and contributors/writers/authors of articles have or may have an outstanding buy or sell position or holding in the securities, options on securities or other related investments of issuers and/or companies discussed therein. The content of the articles and the interpretation of data are solely the personal views of the contributors/ writers/authors. Investors must make their own investment decisions based on their specific objectives, resources and only after consulting such independent advisors as may be necessary.


