


Gold has long been a cornerstone of investment and cultural significance in India. From weddings and religious rituals to financial security, the value of gold runs deep in the country’s history.
As an investment asset, it has consistently been perceived as a hedge against inflation, a safe haven in times of economic instability, and a symbol of wealth and prosperity. However, with gold prices at Rs 85,000 per 10 grams, many question whether it is still worth investing in gold.
Is the gold rate today too high, or does gold still hold the potential for returns in the coming months? To understand this, we need to look beyond the cultural significance, considering the market trends and charts that provide insights into the current gold price movement.
Gold Monthly Chart

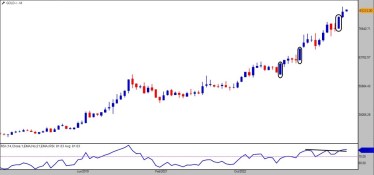
Source: TradePoint
The monthly chart of continuous contracts for MCX Gold Futures offers a promising view for long-term investors. A clear series of strong, long, bullish candles indicate a sustained upward trend, suggesting that the gold price has been moving upward for a considerable time. The advantage of such strong trending candles is that their lows often act as strong support levels in the future.
On the lower panel of the chart, the Relative Strength Index (RSI) shows a bullish range shift. The RSI is a momentum indicator and its bullish range shift signals that the upward trend may continue. When the RSI is above 60 and moving higher, it suggests strength in the trend. In this case, the RSI confirms the strong bullish trend, indicating that, from a medium-term perspective, gold prices are expected to remain on the rise.
Thus, the monthly chart supports the idea that the medium-term trend for gold potential remains bullish, making it a favourable asset for investors looking to ride the trend in the coming months.
Gold Daily Chart
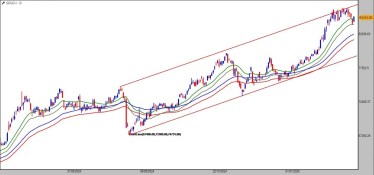
Source: TradePoint
Shifting to the daily chart, we see a more nuanced picture. Gold has encountered resistance at a rising channel pattern around the Rs 86,500 level. This resistance at higher levels suggests that the price is consolidating rather than sharply reversing, indicating time correction rather than price correction. The fact that the price has not sharply reversed after hitting the resistance is important—it suggests that the market is still in a strong demand zone and might be preparing for another move higher once the consolidation phase ends.
Moreover, a couple of per cent retracements from the recent high are evident, which could be seen as a healthy pullback before a possible continuation of the uptrend. This retracement aligns with forming a Bull-Sash candlestick pattern at the 21-Day Exponential Moving Average (21DEMA) channel. The 21DEMA and 50DEMA are commonly used as support zones, and the price holding up near these levels indicates strong buying interest at these points.
The presence of bullish candlestick patterns at these key support zones suggests that the demand for gold remains solid, and the price could potentially rise again once the consolidation phase concludes.
When should you invest in gold?
Based on both the monthly and daily charts, gold seems to be in a strong medium-term bullish trend, though there might be short-term price fluctuations as it consolidates. Investors looking for a long-term play should not be discouraged by the current price of Rs 85,000 per 10 grams, as the bullish trend appears intact. However, for short-term traders, the current resistance at Rs 86,000 per gram and the ongoing consolidation suggests waiting for a pullback to lower levels—preferably near the 21DEMA or 50DEMA channels—might be better before entering.
Whether gold is worth investing in at Rs 85,000 depends on your investment horizon. For those with a medium to long-term view, gold remains a valuable asset, especially given its historical track record of wealth preservation and the ongoing bullish trend indicated by the charts. However, waiting for a better entry point for short-term traders could prove beneficial.
Disclaimer
Note: We have relied on data from http://www.definedgesecurities.com throughout this article. Only in cases where the data was unavailable have we used an alternate but widely used and accepted source of information.
The purpose of this article is only to share interesting charts, data points and thought-provoking opinions. It is NOT a recommendation. If you wish to consider an investment, you are strongly advised to consult your advisor. This article is strictly for educative purposes only.
Brijesh Bhatia has over 18 years of experience in India’s financial markets as a trader and technical analyst. He has worked with the likes of UTI, Asit C Mehta, and Edelweiss Securities. Presently he is an analyst at Definedge.
Disclosure: The writer and his dependents do not hold the Stocks discussed in this article. However, clients of Definedge may or may not own these securities.
The website managers, its employee(s), and contributors/writers/authors of articles have or may have an outstanding buy or sell position or holding in the securities, options on securities or other related investments of issuers and/or companies discussed therein. The articles’ content and data interpretation are solely the personal views of the contributors/ writers/authors. Investors must make their own investment decisions based on their specific objectives, resources and only after consulting such independent advisors as may be necessary.


