
India’s travel boom is hard to miss. Domestic airlines carried over 8.64 crore passengers in the first half of 2026, up 1.44% from the year-ago period. Leisure travel is still strong, business travel is mostly back to normal, and foreign tourist arrivals are still strong.
The most visible beneficiaries have been airlines and airport operators. But another segment of the travel ecosystem has quietly been posting some of its strongest operating numbers in recent quarters: hotels.
Occupancy levels remain above 70% and average room rates are at record highs. Yet, if you look, most hotel stocks have either corrected or underperformed the broader market over the past year. This gives the impression that the hotel industry is going through a rough patch.
However, the weakness in the stock price tells only part of the story. While investors continue to focus on occupancy, average room rate (ARR), and room additions, a closer look at return ratios shows that only a handful of hotel companies are generating superior returns from the capital they employ.
Capital Efficiency Is Emerging as the Key Differentiator
During the post-pandemic recovery, almost every hotel benefited from rising occupancy and record room rates. Investors rewarded companies simply for adding rooms because demand consistently outpaced supply.
As the industry moves into its next phase, future returns are more likely to be driven less by cyclical pricing power and more by the efficiency with which management allocates capital.
Historically, hotel companies were evaluated based on occupancy, average room rates (ARR), Revenue per Available Room (RevPAR), and room additions. These metrics are still important, but they don’t tell us much about whether a company is creating long-term shareholder value.
This is where return ratios like Return on Capital Employed (ROCE) and Return on Equity (ROE) become more useful. They show how efficiently a business is turning capital into profits and if further investments are yielding good returns.
Applying this filter significantly narrows the investment universe. Among the listed players, only IHCL, Chalet Hotels and Lemon Tree Hotels qualify. Several peers continue to report healthy operating performance but fall short on capital efficiency.
Three Companies, Three Different Business Models
Although the three companies generate similar return ratios, they have taken very different routes to achieve them.
#1. Indian Hotels Company (IHCL): Scaling Through Capital-Light Growth
The owner of Taj Group of Hotels, IHCL has steadily transformed itself from a traditional hotel owner into a diversified hospitality platform. Management contracts, where it manages third-party property, now constitute nearly 68% of IHCL’s operating portfolio and 93% of its development pipeline. This enables the company to grow with less capital and better return ratios.
This approach is also paying off with consistent financial results. The company clocked 16% revenue growth in FY26 with EBITDA (Earnings Before Interest, Tax, Depreciation, Amortisation) margin close to 33%, led by disciplined execution and operating leverage.
IHCL: Financial Performance
| Metrics | FY25 | FY26 | YoY Growth |
| Sales (₹ crore) | 8,335 | 9,689 | 16.0% |
| Operating EBITDA Margin (%) | 33.2 | 33.0 | -20 bps |
| Net Profit (₹ crore) | 1,603 | 1,849 | 15.3% |
| Return on Capital Employed (%) | 16.7 | 17.3 | +60 bps |
IHCL: Improving Capital Efficiency

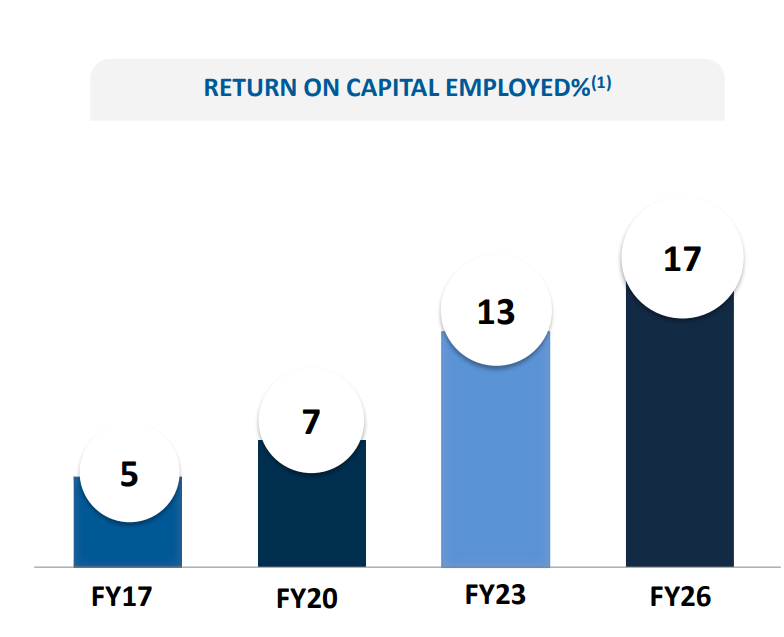
IHCL’s ROCE trend stands out. The company’s ROCE has improved from 5% in FY17 to 17% in FY26, indicating that every rupee of capital deployed is generating significantly higher returns.
This has been largely helped by its capital-light expansion strategy where hotel owners invest in the assets while IHCL earns management and brand fees. The strategy has also generated a steady stream of high-margin fee income.
Between FY23 and FY26, management fee income has grown at a CAGR of 20%, rising from ₹399 crore to ₹685 crore. With over 90% of its development pipeline under management contracts, the company expects a further year of double-digit growth in FY27.
IHCL: 1yr Stock Price Chart

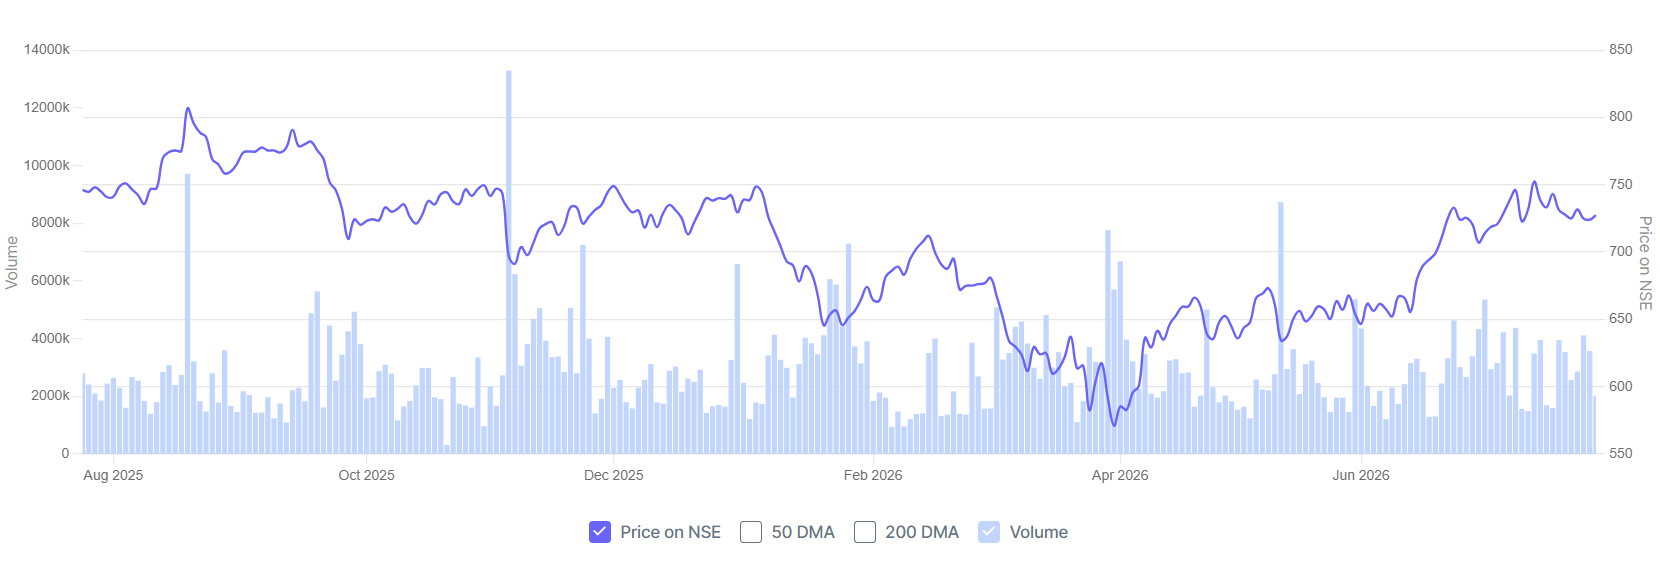
Despite the improved performance, IHCL stock price performance has been flat over the past year.
#2. Chalet Hotels: Proving Asset Ownership Can Still Deliver High Returns
Unlike IHCL, Chalet has not aggressively pursued an asset-light strategy. Instead, it has focused on extracting higher returns from the assets it already owns.
Over the past two decades, the company evolved from a pure-play hotel asset owner to a hybrid hospitality platform with capabilities in hotel operations, franchise management, commercial real estate and residential projects. It has also built up a portfolio of premium hotels in high-demand business districts and mixed-use developments, allowing its properties to generate strong cash flows.
Chalet Hotels: Financial Performance
| Metrics | FY25 | FY26 | YoY Growth |
| Sales (₹ crore) | 1,754 | 2,812 | 60.3% |
| EBITDA Margin (%) | 44 | 43.7 | -30 bps |
| Net Profit (₹ crore) | 143 | 645 | 351% |
| Return on Capital Employed (%) | 11.0 | 17.0 | +600 bps |
The strategy has resulted in better financial performance. In FY26, Chalet Hotels reported revenue growth to ₹2,812 crore, up 60%, and EBITDA margins were stable at 44%. Net profit during the period rose 351% to ₹645 crore from ₹143 crore in FY25.
Its return ratios also reflect the improvement in capital utilisation, with ROCE rising from 11% in FY25 to 17% in FY26. Management expects the growth momentum to continue, supported by higher contribution from recently commissioned hotels, operational improvements across the portfolio and disciplined capital allocation.
Chalet Hotel: 1yr Stock Price Chart

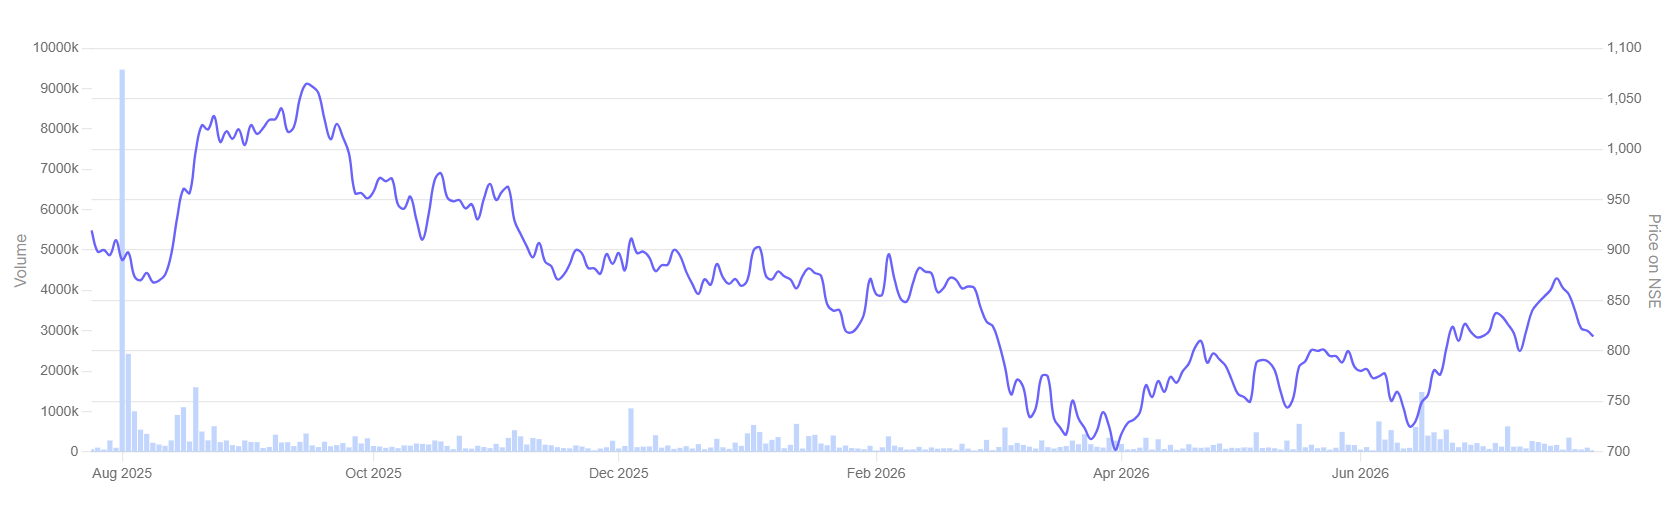
While Chalet continues to improve its capital efficiency, the market appears to be discounting near-term concerns.
#3. Lemon Tree Hotels: Unlocking Capital Efficiency Through Restructuring
Lemon Tree Hotels is undergoing a structural transformation. The company built its business by owning and operating hotels and is now moving to an asset-light model where it separates hotel ownership from hotel operations.
The centre of this structural transformation is the proposed demerger of Fleur Hotels, under which owned hotel assets will be transferred to a separate entity. Fleur is backed by Warburg Pincus and will own and develop hotel assets, while Lemon Tree earns long-term management fees by operating them.
This will allow Lemon Tree to scale up with substantially lower capital requirements and generate recurring management fee income.
Lemon Tree Hotels: Financial Performance
| Metrics | FY25 | FY26 | YoY Growth |
| Sales (₹ crore) | 1,288 | 1,453 | 12.8% |
| Operating EBITDA Margin (%) | 49.4 | 48.1 | -130 bps |
| Net Profit (₹ crore) | 243 | 288 | 18.6% |
| Return on Capital Employed (%) | 13.0 | 14.0 | +100 bps |
Also, the strategy yielded good financial results. Revenue rose 12.8% to ₹1,453 crore in FY26 while net profit increased 18.6% to ₹288 crore. EBITDA margin declined on account of renovation costs and investments towards technology and GST-related changes. Management expects these pressures to ease over the next couple of years.
Growing Earnings from Fee-based Model


Management and franchise fee income from third-party hotels grew 23% YoY to ₹73.9 crore, and management fee income from managing Fleur Hotels grew 8% to ₹95.8 crore.
The company’s growing management portfolio, recurring fee income, lower capital intensity and planned demerger position the company for structurally higher returns on capital. Post demerger, Lemon Tree will be a debt-free, high-margin and high ROCE company with strong free cash flows from fees and brand-related income.
Lemon Tree Hotels: 1yr Stock Price Chart

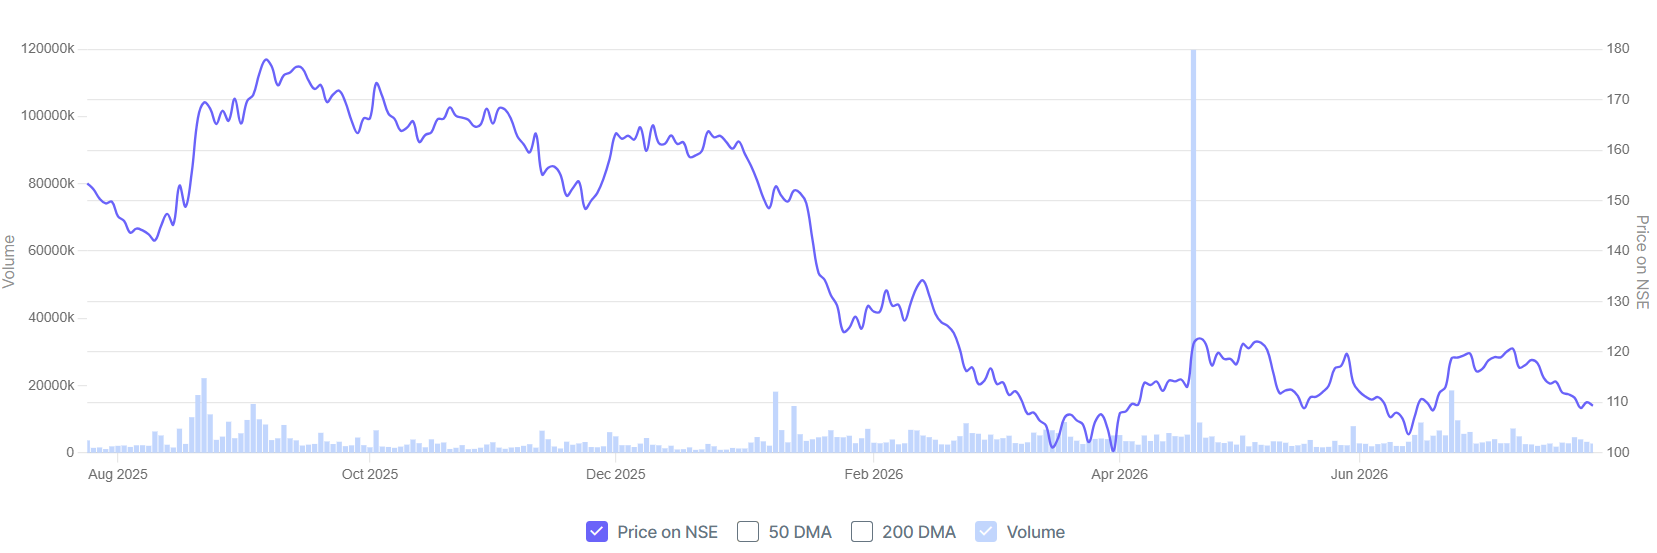
The stock has corrected sharply from its 52-week high level of ₹181, suggesting the market is waiting for evidence that the company’s asset-light transition can translate into higher returns on capital.
Valuations Have Cooled, But Not Equally
Despite improving return ratios, all three companies trade below their own five-year median PE and EV/EBITDA multiples (Enterprise Value/Earnings Before Interest, Tax, Depreciation, Amortisation), which compares a company’s total value with its operating earnings.
Valuation Trend
| Company | EV/EBITDA | 5 yr Median EV/EBITDA | P/E | 5 yr Median PE |
| IHCL | 29.1 | 35.1 | 53.3 | 64.0 |
| Chalet Hotels | 16.2 | 31.7 | 27.6 | 71.5 |
| Lemon Tree | 15.1 | 24.4 | 34.9 | 66.7 |
IHCL is currently trading at 29.1x EV/EBITDA and 53.3x PE, which is lower than its 5-year median multiples of 35.1x and 64x, respectively. The relatively minor correction suggests investors still give a premium to the proven asset-light strategy and consistent execution of the company.
The derating has been far steeper for Chalet Hotels and Lemon Tree. Chalet’s EV/EBITDA has almost halved from its five-year median of 31.7x to 16.2x, while its P/E has declined from 71.5x to 27.6x.
Similarly, Lemon Tree trades at 15.1x EV/EBITDA and 34.9x P/E, well below its historical averages of 24.4x and 66.7x, respectively.
The compression in valuations indicates that investors are looking beyond the current earnings cycle. The post-pandemic recovery was supported by record occupancy, strong pricing power and limited room supply.
As room additions accelerate over the next few years, the market appears to be factoring in a moderation in earnings growth. In such an environment, companies that can continue improving returns on capital through better capital allocation and operating efficiency are likely to command valuation premiums over the long term.
The Efficiency Trade Is Just Beginning
A common feature of two of the three companies with the strongest return ratios is their transition towards asset-light growth. Instead of owning more hotels, they are increasingly expanding through management contracts. This mirrors a broader shift across the global hospitality industry, where brands such as Marriott, Hilton and Hyatt have long prioritised fee-based earnings over capital-intensive ownership.
India’s hotel industry now appears to be moving in the same direction. As the post-pandemic recovery matures and room supply gradually increases, investors are likely to place greater emphasis on capital allocation than on occupancy growth or room additions alone. Companies that can expand through asset-light models and generate higher returns on every incremental rupee of capital are likely to enjoy a structural advantage.
Every hotel cycle creates winners, but the biggest long-term wealth creators are rarely those that build the most rooms. Instead, they are the companies that consistently generate more earnings from every rupee they invest. As India’s hospitality industry evolves, capital allocation may prove to be an even more enduring competitive advantage than occupancy itself. Add these stocks to your watchlist and track how well they execute their growth strategies.
Disclaimer:
Note: We have relied on data from www.Screener.in throughout this article. Only in cases where the data was not available, have we used an alternate, but widely used and accepted source of information.
The purpose of this article is only to share interesting charts, data points and thought-provoking opinions. It is NOT a recommendation. If you wish to consider an investment, you are strongly advised to consult your advisor. This article is strictly for educative purposes only.
Deepan Datta has spent over a decade studying stocks and mutual funds. His passion is to uncover interesting stories in the financial markets and share them through his writings with investors at large. He is focused on delivering clear, easy to understand and research-backed insights. Deepan began his career as a Research Associate at S&P Global, where he developed a strong foundation in financial research and data analysis.
Disclosure: The writer and his dependents do not hold the stocks discussed in this article.
The website managers, their employees (s), and contributors/writers/authors of articles have or may have an outstanding buy or sell position or holding in the securities, options on securities or other related investments of issuers and/or companies discussed therein. The content of the articles and the interpretation of data are solely the personal views of the contributors/ writers/authors. Investors must make their own investment decisions based on their specific objectives, resources and only after consulting such independent advisors as may be necessary.