
The market has a funny way of rewarding the patient. There are weeks when nothing seems to move. Stocks keep oscillating in a range, traders lose interest, and everyone starts chasing the latest trending theme. Then suddenly, without much notice, a few charts quietly begin to change character. Resistance levels that held for months give way, consolidation zones are left behind, and buyers start taking control.
That is precisely what caught my eye this week. Three smallcap stocks have developed interesting Point & Figure chart formations. The stocks are all telling different stories, but the story is simple. Buyers seem to be gaining strength at important technical levels.
Let’s go through these charts one by one.
1. Manappuram Finance: New Breakout After Months of Consolidation
One thing all strong trends need before the next leg up is a pause. That’s exactly what Manappuram Finance has been doing.

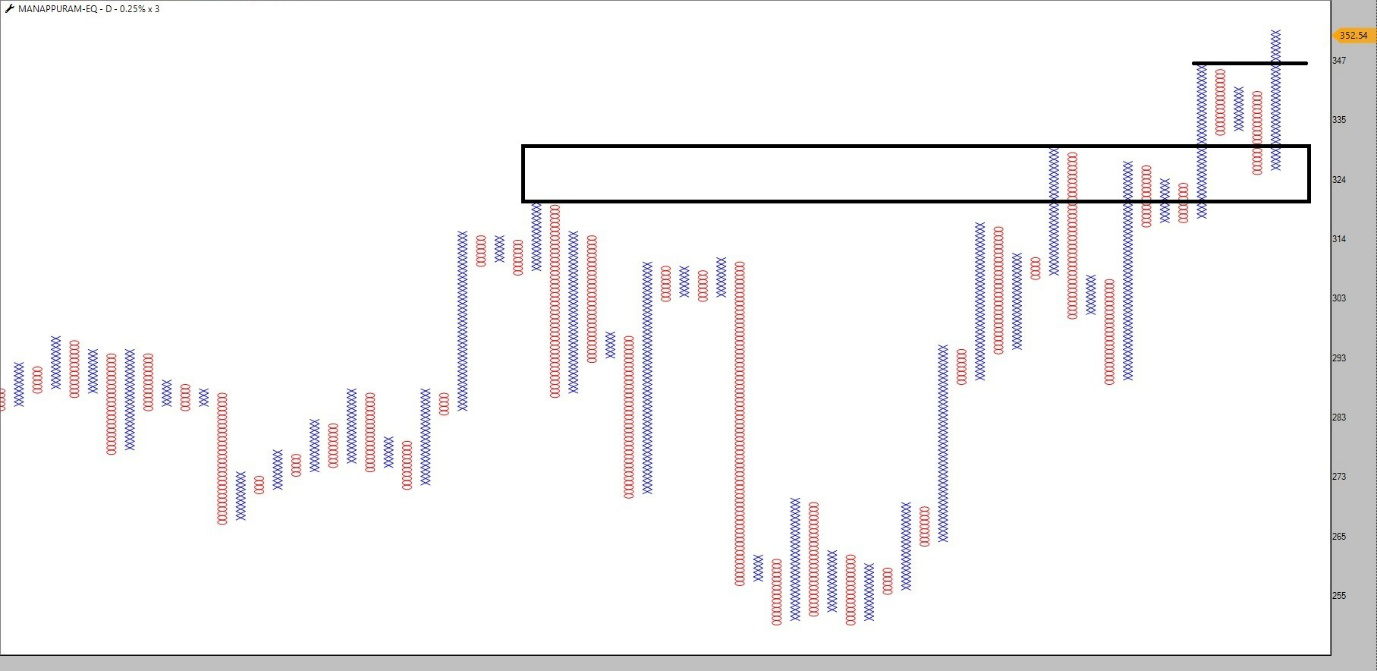
The stock entered a wide consolidation zone between approx. Rs 320 and Rs 330 after a strong up move. A lot of traders tend to mistake this kind of sideways action for weakness. What actually takes place in healthy consolidations is that shares are transferred from weak hands to strong hands.
The longer the consolidation, the more meaningful the breakout generally is.
Manappuram tried several times to break above the resistance zone on the Point & Figure chart but could not sustain above it. But every dip found buyers at higher levels, indicating demand was slowly picking up.
Finally, the stock has been able to break out from the consolidation range.
This breakout is significant because it is not coming off a sharp decline. Instead, it follows a long period of price absorption.
The setup is even stronger as the stock has already started to make higher highs and higher lows before the breakout. That tells us institutions may have been quietly building positions. The earlier resistance zone around Rs 320-330 now has the potential to turn into a support area.
The probability of continuation is favourable as long as the stock stays above this breakout region. For investors, this is often the kind of setup you want to monitor rather than chase stocks that have already doubled.
2. Dr Lal Path Labs: Old Triangle Set To Explode
Some chart patterns do not need complicated indicators. Often an entire triangle can be revealed. Dr. Lal PathLabs has spent many months forming a large symmetrical triangle on the Point & Figure chart.
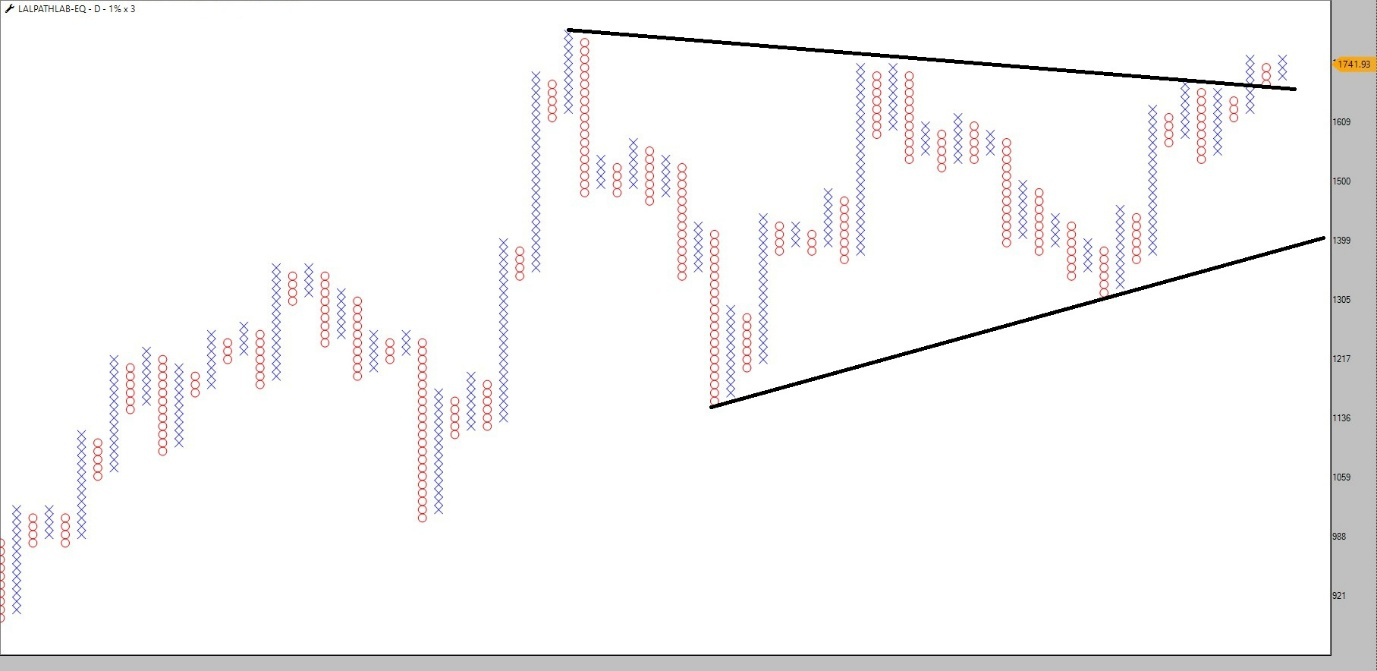
Each rally has ended with a falling resistance line. Meanwhile, each correction has stopped at a higher level than the previous one.
In other words, sellers are less aggressive and buyers are more confident. The gap between buyers and sellers keeps narrowing until one side wins conclusively. That is where the stock is right now.
Price has reached the top of the triangle and is trying to break above the falling trend line. Triangle breakouts tend to be strong as they build up months of energy. Imagine you are compressing a spring. The more you compress, the more you release.
A convincing breakout above the trendline could draw fresh momentum buying, especially as many traders are watching such classical chart formations.
Another positive aspect is that the stock has been able to recover sharply from previous corrections, indicating that buying interest continues to emerge whenever prices soften.
Professional traders usually prefer to wait for confirmation and get in rather than predicting the breakout. That helps reduce false signals and increases the probability of success.
3. Karur Vysya Bank: Getting Stronger
Sometimes the best charts don’t look like much. They just keep climbing. Karur Vysya Bank has been in a clearly defined uptrend for quite some time now.
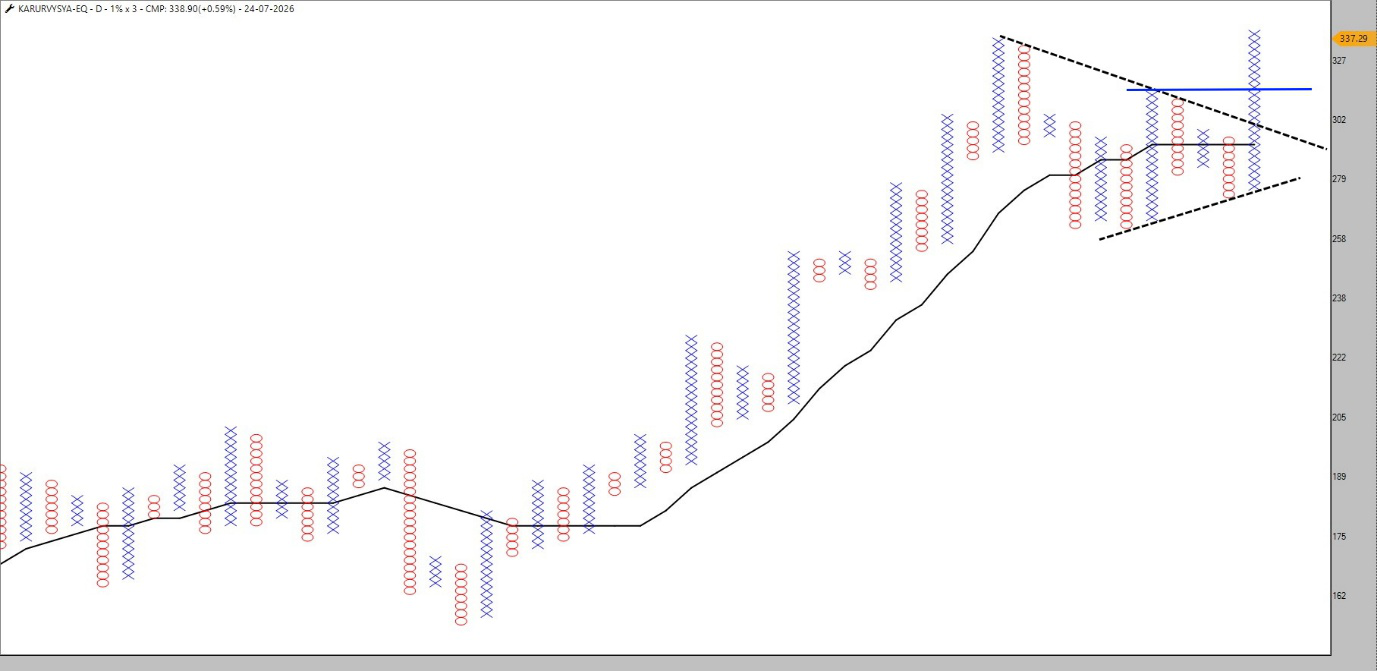
The stock has been making a series of higher highs and higher lows instead of deep corrections, which is one of the healthiest characteristics of a bullish trend. The stock has recently developed a contracting consolidation pattern.
The upper trendline continued to slope lower and the lower trendline continued to slope higher, which created a narrowing trading range.
Unlike many weak consolidations that form before an uptrend gets established. Often when consolidation happens after a long rally, it is a continuation pattern and not a reversal.
The latest Point & Figure column implies buyers are attempting to push above the immediate resistance zone. A successful breakout of this pattern would be a sign that the main uptrend is ready to continue. Another positive is the fact that the stock is still trading well above its long-term bullish support structure. That means the bigger trend is still intact.
For trend-following traders, this is potentially a better risk-reward trade than entering after a vertical rally.
Why Are These 3 Charts Interesting?
These stocks are in different sectors, financial services, healthcare diagnostics and banking, but their charts are telling the same story.
Each stock has consolidated long enough before trying to move higher.
This is important, as sustainable rallies are usually built on strong foundations.
Markets don’t go up in a straight line. They move forward, pause, consolidate, absorb supply and then go higher. Many retail investors get bored and impatient during these dull periods.
And all three charts show an improving price structure.
- Manappuram Finance has broken out of a broad consolidation zone.
- Dr Lal PathLabs is testing the upper end of a multi-month triangle.
- Karur Vysya Bank trying to resume its primary uptrend after a healthy consolidation.
These three smallcap names are worth keeping on your watchlist, not because they are guaranteed winners, but because they are exhibiting the kind of technical behaviour that often precedes meaningful moves. As usual, wait for the story to be confirmed by price first. In trading, patience is not just a virtue, it is often the greatest competitive advantage.
Disclaimer:
Note: The purpose of this article is only to share interesting charts, data points and thought-provoking opinions. It is NOT a recommendation. If you wish to consider an investment, you are strongly advised to consult your advisor. This article is strictly for educative purposes only.
Brijesh Bhatia is an Independent Research Analyst and is engaged in offering research and recommendation services with SEBI RA Number – INH000022075. He has two decades of experience in India’s financial markets as a trader and technical analyst.
Disclosure: The writer and his dependents do not hold the stocks discussed here.
The website managers, its employee(s), and contributors/writers/authors of articles have or may have an outstanding buy or sell position or holding in the securities, options on securities or other related investments of issuers and/or companies discussed therein. The content of the articles and the interpretation of data are solely the personal views of the contributors/ writers/authoRs Investors must make their own investment decisions based on their specific objectives and resources, and only after consulting such independent advisors if necessary.