
Every long-term wealth creation story begins with a structural shift. For India, that shift is happening in household savings. For decades, surplus money flowed into fixed deposits, gold, and real estate. But post 2020, that is changing gradually.
The 82 Lakh Crore Financialization Story
Today, an increasing share of savings is flowing into mutual funds through Systematic Investment Plans, equity schemes, and passive products. The result has been extraordinary. Over the last decade, the mutual fund industry’s assets under management (AUM) have grown from ₹14.2 lakh crore as of April 2016 to nearly ₹82 lakh crore as of April 2026, while monthly SIP inflows have surged almost tenfold to ₹31,115 crore.
Yet the opportunity remains significant. According to the Association of Mutual Funds of India, India’s mutual fund AUM is still 19.9% of Gross Domestic Product, significantly below that of mature markets such as the US (124%), Canada (85%), and even Brazil (73%). This implies that the industry’s growth runway is still long.
In such a business, every additional rupee invested by households translates into higher AUM, stronger fee income, and better operating leverage for asset managers. This makes listed AMCs one of the cleanest ways to participate in India’s financialisation story.
While SBI Mutual Funds remains the market leader, these three listed companies rank just behind it and are well-positioned to benefit from India’s expanding mutual fund industry.
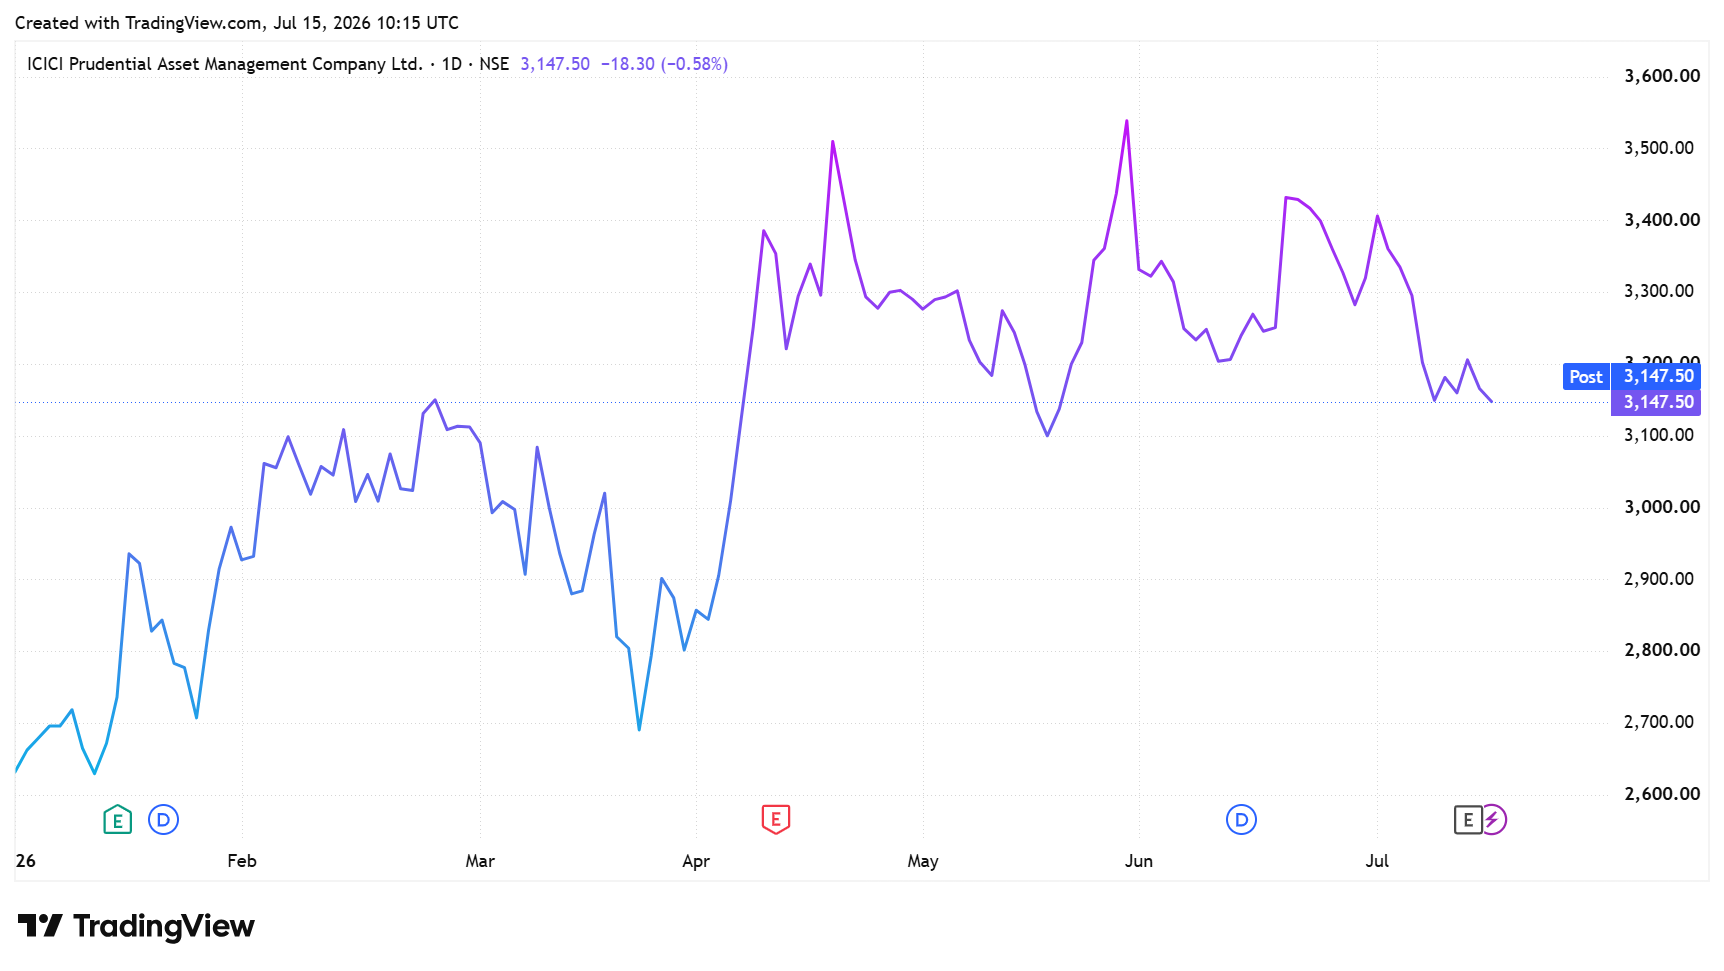
#1 ICICI AMC: The ₹11.2 Lakh Crore Giant
ICICI Prudential AMC, part of the ICICI Group, is one of the oldest and second-largest asset management companies in India. Its presence extends to mutual funds, portfolio management services, alternative investment funds, and advisory services to offshore clients.
The Distribution Engine
As of the year ended 31 March 2026, the company serves 170 lakh unique customers. It has a pan-India presence with 281 offices spanning 23 states and 4 union territories. Its distribution mix is diversified with over 114,000 empaneled distribution partners, including Mutual Fund Distributors, National Distributors, and Banks.
Active Equity Dominance Drives AUM
The company’s total Mutual Fund Quarterly Average Asset Under Management (QAAUM) stood at ₹11.0 lakh crore (up 25.6% YoY), translating to a market share of 13.5%. For mutual fund equity schemes, mutual fund distributors (MFDs) bring in 36.7% of the QAAUM, followed by direct channels (28.9%), national distributors (15.5%), other banks (11.0%), and ICICI Bank (7.9%)
ICICI’s strength lies in active mutual funds, with ₹9.2 lakh crore in QAAUM (up 21.9% YoY) and a 13.7% market share. In the equity-oriented hybrid scheme category, the market share stands at a commanding 26.7%. ICICI AMC is well-positioned for better earnings quality with a high active mutual fund mix of approximately 83.3% of its total MF QAAUM, as active and equity-oriented schemes offer higher yields than debt-oriented or passive schemes
The SIP Moderation Reality
The company has seen a strong historical trajectory in systematic investment plan (SIP) inflows. Monthly inflows grew from ₹2347.0 crore in March 2023 to ₹3359.0 crore in March 2024, ₹3906.0 crore in March 2025, and ₹5,104 crore by the end of FY26. However, in the quarter ended 30 June 2026, SIP moderated slightly to ₹ 4872.0 crore due to muted market activity.
ICICI Prudential AMC: Key Operating & Financial Highlights
| Parameter | FY26 | Key Takeway |
| Mutual Fund QAAUM | ₹11.0 lakh crore | Up 25.6% YoY |
| Active Mutual Funds | 83.3% (₹9.2 lakh crore) | Key Driver of High Yield |
| Monthly SIP Inflow | ₹5,104 crore | Strong inflows |
| Operating Revenue | ₹5,764.6 crore | Up 23.1% YoY |
| Net Profit | ₹3,298.3 crore | Up 24.4% YoY |
| Yield | 52 bps | Strong Due to High Active Equity-mix |
| Source: Q4FY26 Investor Presentation | ||
FY26 Profit Margins and AI Integration
Financially, the company’s operating revenue grew by 23.1% year-on-year to ₹5,764.6 crore. The gross yield, on an annualized basis, stood at 52 bps, and the operating margin improved to 37.6 bps. Operating Profit Before Tax surged by 28.9% to ₹4,170.5 crore. As a result, net profit grew by 24.4% to ₹3,298.3 crore.
Further, in Q1FY27, operating revenue grew by 17.6% year-on-year to ₹1,564.2 crore with a yield of 52 bps. Operating Profit Before Tax surged by 20.2% to ₹1,099.8 crore. As a result, net profit grew by 23.1% to ₹964.6 crore.
Looking ahead, management expects the operating leverage to offset any industry-wide margin compression. To further drive this operating leverage, it is integrating Agentic AI to automate routine tasks and SIP renewal calls. This could enable cost efficiencies. Further, the company is scaling the high-margin alternative businesses like PMS and AIF.

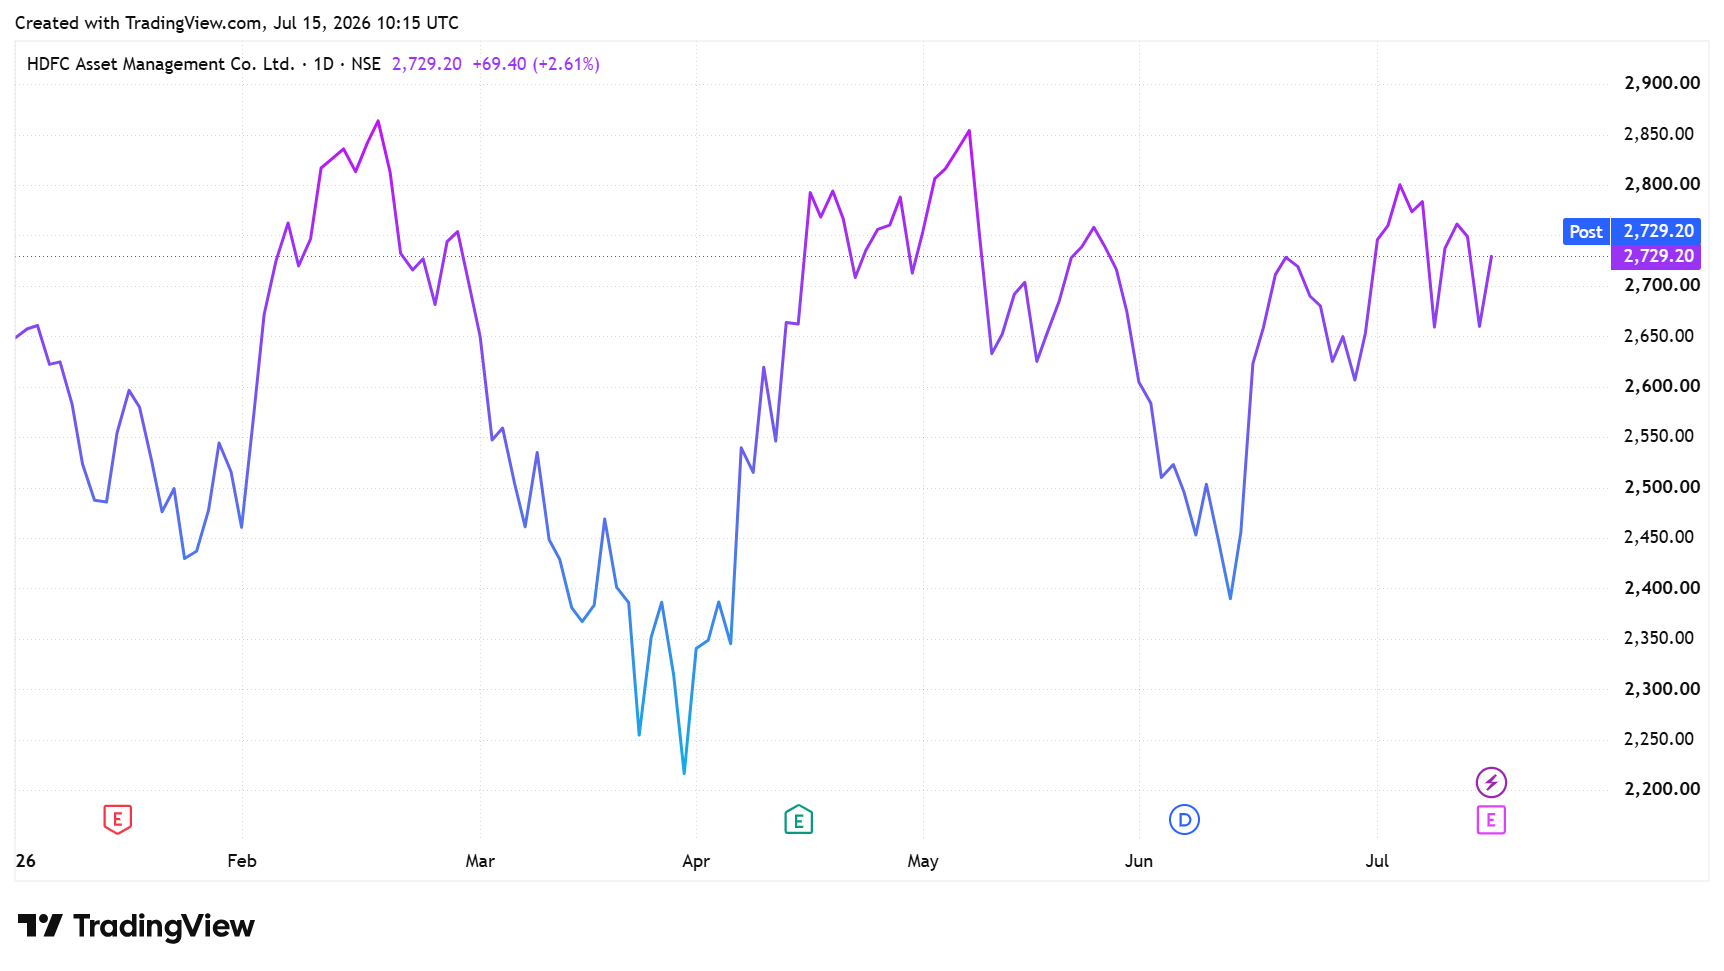
#2 HDFC AMC: The ₹9.3 Lakh Crore Behemoth
HDFC AMC is a subsidiary of HDFC Bank and a group company of HDFC Group. The company offers mutual funds (active and passive), options such as AIFs and PMS, and international trading through its wholly owned subsidiary in GIFT City.
With a closing QAAUM of ₹9.3 lakh crore in FY26 (up 20% YoY), it remains India’s third-largest AMC with 11.4% market share. Of the total AUM, 44.6% comes from direct channels, MFDs (23.7%), national distributors (22.0%), and banks (9.7%). Of the bank share, HDFC Bank accounts for 5.2%.
Expanding Footprint Beyond the Top 30 Cities
The company holds a 12% market share in the B-30 (beyond the top 30 cities) market. It receives 80.8% of its MAAUM (monthly average AUM) from the Top 30 cities, with the remaining 19.2% coming from B-30 locations. It serves approximately 98% of PIN codes across India through 280 offices and over 1,09,000 distribution partners.
The company boasts 167 lakh unique investors and 302 lakh live accounts. Actively managed equity-oriented AUM comprises 61% (₹5.6 lakh crore) of the company’s QAAUM. HDFC AMC holds a 13% market share in actively managed equity-oriented schemes.
HDFC AMC: Key Operating & Financial Highlights
| Parameter | FY26 | Key Takeway |
| Mutual Fund QAAUM | ₹9.3 lakh crore | Up 20% YoY |
| Equity-Oriented AUM | 61% (₹5.6 lakh crore) | Relatively Lower than ICICI AMC |
| Monthly SIP & STP Inflow | ₹4,880 crore | Supported by ₹2.0 lakh crore SIP AUM |
| Operating Revenue | ₹4,119 crore | Up 18% YoY |
| Net Profit | ₹2,859.2 crore | Up 16% YoY |
| Yield | 45 bps | Lower than ICICI AMC due to relatively lower Active AUM Mix |
| Source: Q4FY26 Investor Presentation | ||
Retail Investors & Account Growth
The growth in equity AUM was primarily driven by retail investors. The number of live individual accounts grew by 30% to 300.9 lakh in FY26. This led to a 16% increase in individual MAAUM (Monthly Average AUM) to ₹6.2 lakh crore, representing 68.2% of the total MAAUM.
The company enjoys strong market penetration; 27% of all mutual fund investors in India have chosen HDFC AMC. In FY26, the company added 35 lakh unique investors. Furthermore, HDFC AMC has an increasingly strong foothold in systematic transactions, processing ₹4,880 crore in SIP and STP flows each month. Its total SIP AUM now stands at an impressive ₹2.0 lakh crore.
FY26 Financials Highlight 16% Profit Surge
Financially, revenue from operations increased 18% year-on-year to ₹4,119 crore, while operating profit from the core AMC business rose 18% to ₹3,211.4 crore. Consequently, net profit increased 16% to ₹2,859.2 crore. The company’s overall equity yield stood at 56 bps for FY26, and the blended yield was 45 bps.
The results for Q1FY27 are yet to be announced. Looking ahead, management estimates a 3-4 bps gross impact on existing books. However, the company is actively offsetting this by optimizing distribution commission structures and indirect costs. Thus, management expects no material impact on the company’s net profit.
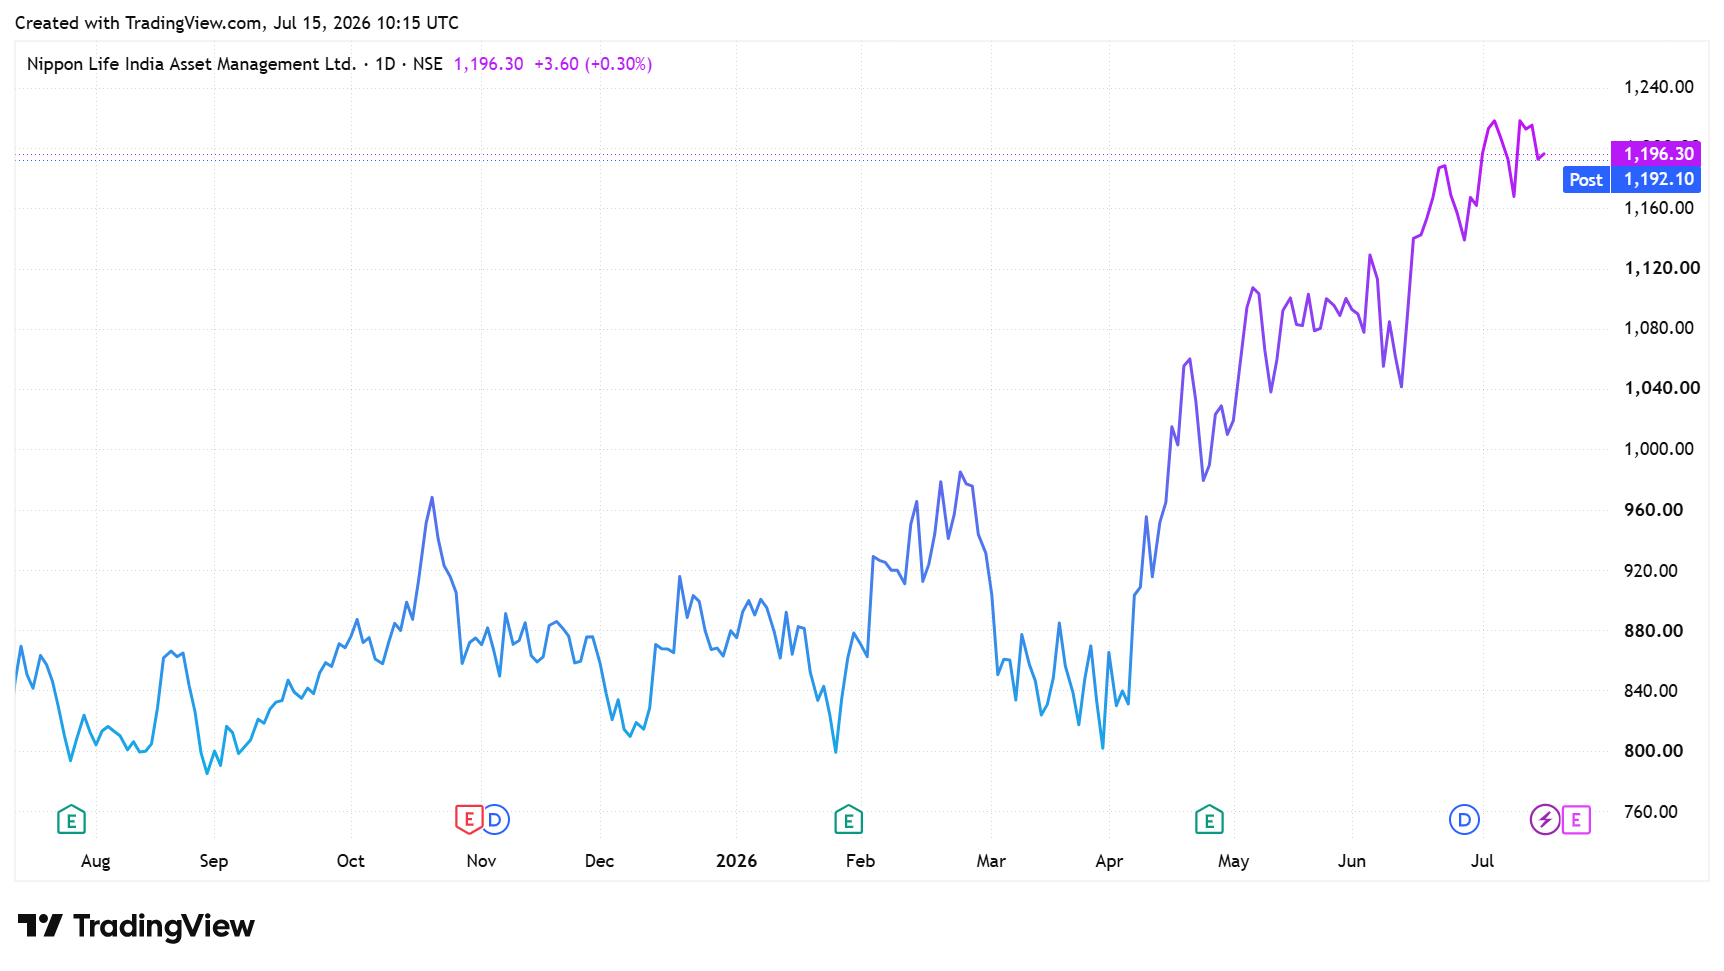
#3 Nippon Life AMC: The ₹7.7 Lakh Crore Giant
Nippon Life India Asset Management (NAM India) remains India’s fourth-largest AMC by both Total and Equity QAAUM, and is the largest non-bank-sponsored and foreign-owned AMC in the country. The company offers a comprehensive suite of products across active and passive segments of mutual funds.
The company’s total AUM has reached ₹7.7 lakh crore as of Q4FY26. In the mutual fund sector specifically, it registered a QAAUM of ₹7.3 lakh crore, driving its overall market share up by 63 bps to 8.9%, its highest share since June 2019. Its market share in the equity segment increased to 7.2%.
Asset Diversification and B-30 Penetration
The mutual fund AUM is highly diversified across asset classes. Equities now account for 45.5% of the total AUM, while the rapidly growing Exchange-Traded Funds segment has surged to make up 33.4% of the portfolio. Debt funds contribute 13.4%, liquid funds (5.4%), and arbitrage funds make up the remaining 2.3%.
The company especially excels in the B-30 sector, which accounts for 20.1% of total AUM, compared with the industry average of 18.2%. Furthermore, NAM India boasts the largest investor base in the industry with 238 lakh unique investors as of March 2026. This means that more than 1 in 3 Indian mutual fund investors are associated with the company.
Distribution Network and SIP Longevity
In terms of distribution, NAM India relies on an extensive network of over 1,23,800 empanelled distributors. Within its distributed assets mix, MFDs account for 56%, banking distributors (25%), and national distributors (19%). The SIP momentum remains robust.
The average systematic book for FY26 reached ₹10,590 crore, up from ₹9,050 crore. SIP AUM also increased by 17% to ₹1.5 lakh crore. Notably, the SIP book exhibits strong longevity, with 47% of its SIP AUM continuing for over five years, far exceeding the industry average of 31%.
Nippon India AMC: Key Operating & Financial Highlights
| Parameter | FY26 | Key Takeway |
| Mutual Fund QAAUM | ₹7.3 lakh crore | Market share increased to 8.9% |
| Equity-Oriented AUM | 45.5% | Equity market share improved to 7.2% |
| Monthly SIP & STP Inflow | ₹10,590 crore | SIP AUM reached ₹1.5 lakh crore |
| Operating Revenue | ₹2,708.7 crore | Up 21% YoY |
| Net Profit | ₹1,529.4 crore | Up 19% YoY |
| Equity Yield | 53 bps | Blended Yield is Unavailable |
| Source: Q4FY26 Investor Presentation | ||
FY26 Financials: Record Profit and HNI Growth
Financially, NAM India recorded its strongest year in FY26. Revenue from operations increased by 21% YoY to ₹2,708.7 crore, while net profit rose by 19% to a record ₹1,529.4 crore. Core operating profit also grew 24% to ₹1,748 crore. Equity yield stood at 53 bps. The results for Q1FY27 are yet to be announced.
Looking ahead, NAM India continues to anchor its growth around the Retail and High Net-Worth Individuals segments. The retail segment’s AUM grew by 20% in FY26, while the HNI segment grew by 45%, expanding their respective market shares to 9.46% and 9.00%.
Evaluating Capital Efficiency and Sector Risks
As the second largest player, ICICI AMC stands out with strong Return on Capital Employed (ROCE) and Return on Equity (ROE), followed by Nippon and HDFC AMC. Valuation-wise, all three companies are trading at a premium to the industry median price-to-earnings multiple.
At the same time, Nippon AMC trades at a significant premium to its three-year median valuation multiple, while HDFC AMC trades broadly in line with its historical median valuation multiple.
Particulars | Price-to-Earnings Multiple (X) | Return Ratios | ||
| Company | 3Y Median | ROE (%) | ROCE (%) | |
| ICICI AMC | 45.0 | NA | 85.8 | 115.1 |
| HDFC AMC | 40.1 | 41.4 | 32.9 | 42.9 |
| Nippon AMC | 50.2 | 32.0 | 34.5 | 43.8 |
| Industry | 40.1 | NA | 27.7 | 36.2 |
| Source: Screener.in (As of 14 July 2026) | ||||
While all three AMCs are well-positioned to benefit from India’s long-term financialisation, their competitive strengths differ.
ICICI AMC stands out for its higher active equity mix and superior earnings quality. HDFC AMC offers a balanced franchise backed by deep retail penetration and disciplined cost management. Nippon AMC combines leadership in B-30 markets with strong growth in HNI and passive funds, albeit at a richer valuation.
However, investors should also monitor risks such as prolonged equity market corrections, slower SIP inflows, and regulatory pressure on expense ratios. Valuations have also become costly for some players, leaving limited room for disappointment if earnings growth or industry inflows moderate.
Still, given the long runway for financial wealth creation in India, these companies could be worth keeping on your watchlist.
Disclaimer:
Note: Throughout this article, we have relied on data from http://www.Screener.in and the company’s investor presentation. Only in cases where the data were unavailable have we used an alternative, widely accepted source of information.
The purpose of this article is only to share interesting charts, data points, and thought-provoking opinions. It is NOT a recommendation. If you wish to consider an investment, you are strongly advised to consult your advisor. This article is strictly for educational purposes only.
About the Author: Madhvendra has been deeply immersed in the equity markets for over seven years, combining his passion for investing with his expertise in financial writing. With a knack for simplifying complex concepts, he enjoys sharing his honest perspectives on startups, listed Indian companies, and macroeconomic trends.
A dedicated reader and storyteller, Madhvendra thrives on uncovering insights that inspire his audience to deepen their understanding of the financial world.
Disclosure: The writer and his dependents do not hold the stocks discussed in this article.
The website managers, its employee(s), and contributors/writers/authors of articles have or may have an outstanding buy or sell position or holding in the securities, options on securities, or other related investments of issuers and/or companies discussed therein. The articles’ content and data interpretation are solely the personal views of the contributors/ writers/authors. Investors must make their own investment decisions based on their specific objectives, resources, and only after consulting such independent advisors as may be necessary.