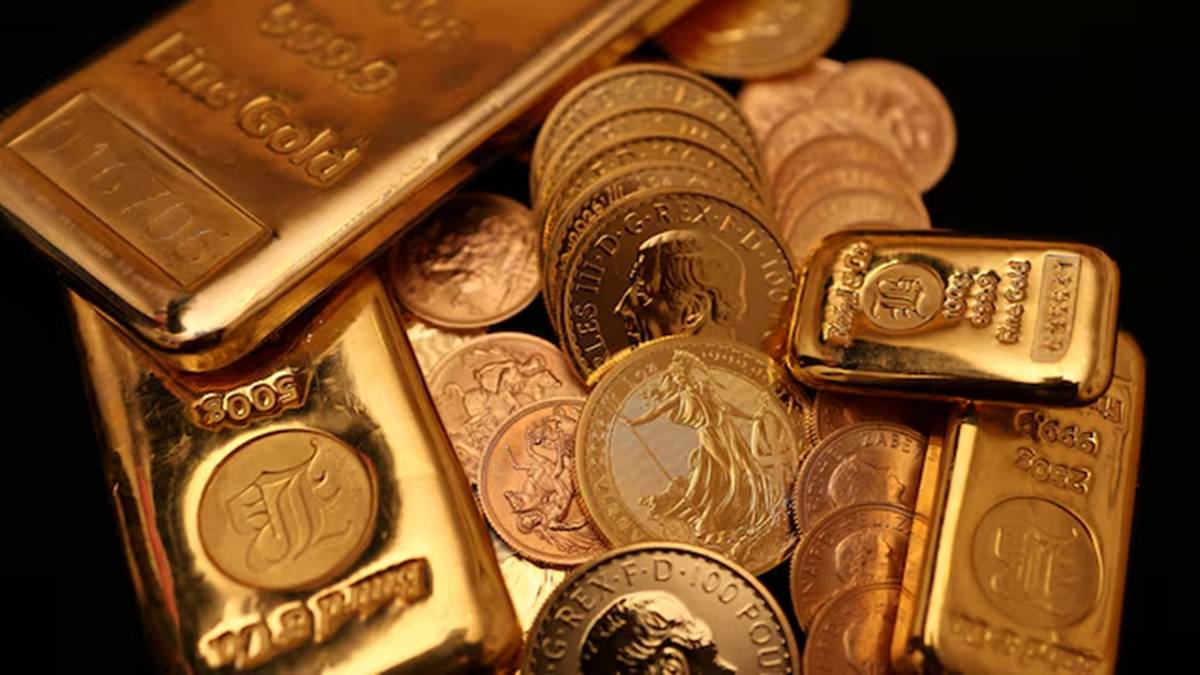
Gold continues to be under pressure, and the headwinds are building up once again.
After reaching an all-time high of $5,602 per ounce in late January, gold has had a rough ride. It fell to under $4,000 at least twice in the last 30 days, and although prices have since recovered to around $4,040, the recovery looks fragile.
So what went wrong? The decline in gold prices this year is mainly linked to the Iran war and its most damaging consequence: the blockage of the Strait of Hormuz. This single chokepoint handles approximately 20% of the world’s oil traffic.
When it was blocked, oil markets went into a tailspin, and Brent price jumped from under $70 before the war to as high as $119, before falling back to pre-war levels when talks of ceasefire arrangements emerged.
But that turned out to be short-lived. The US-Iran talks are off the table, military strikes have resumed, and the price of gold is facing downward pressure once more.
In short, gold never found its footing since the Iran war. Gold price is still up 20% year on year, but is down 6% so far this year. The momentum seen in early 2026, which seemed unstoppable, has, at least for now, stalled.
US Fed and Gold Prices
The other big factor that influences gold prices is interest rates, with which it has a negative correlation. If rates rise, gold prices slump, and the opposite happens when rates fall.
But why does this happen? In a higher-interest-rate environment, gold tends to lose its shine. The reason is simple: gold gives no return — no interest, no dividend. So when interest rates rise, and other investments start offering attractive returns, investors see little reason to hold on to gold. They simply move their money elsewhere, and gold pays the price.
Gold’s fate is closely tied to decisions made in Washington. The US Fed’s FOMC sets the country’s monetary policy, and since gold is traded in dollars, the direction of interest rates set by the FOMC directly affects where gold prices head next.
Kevin Warsh and Gold Prices
Kevin Warsh replaced Jerome Powell at the helm of the central bank right in the middle of the Iran war and walked straight into another problem. US CPI data showed that inflation had re-emerged as a threat.
In his first appearance as Fed chair, Warsh made his intentions clear: bringing inflation lower is the priority. That means interest rates are likely to be kept higher, or even increased, to tame rising prices.
For gold, that is bad news. Higher rates for longer mean investors have even less reason to hold a non-yielding asset like gold. And so, gold remained under pressure.
As of today, inflation remains the biggest factor guiding Warsh and his team’s interest rate decisions. Right now, it is not working in gold’s favour. Markets have already ruled out any rate cut in the near term. And with no rate relief in sight, the case for gold moving higher remains weak.
A rate hike at next week’s FOMC meeting looks unlikely, but do not rule it out entirely. According to CME FedWatch, there is already a more than 50% probability when the Fed officials meet in September. That alone is enough to keep gold on the back foot, unless July US CPI data, to be released in mid-August, throws up positive surprises.
Gold Returns Over the Years
Gold is no stranger to turbulence, like any other asset class. Over several years of recorded history, gold has had its own share of ups and downs: tailwinds pushing prices higher at times, and headwinds putting them under pressure at others.
The 30-year chart below shows that gold prices increased from $380 in July 1996 to $4,040, marking a 950% rise and approximately an 8% annual compound growth rate (CAGR — the average yearly return, smoothed out over the full period ).

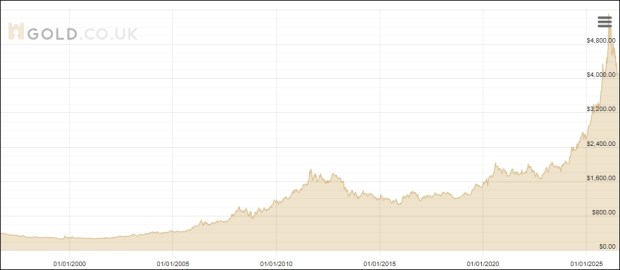
A look at the 30-year chart tells an interesting story. Prices rose between 2000 and 2012, but it was far from a straight-line rise. There were dips, corrections, and even crashes on the way up, and in between, sharp intermittent spikes.
And for those who bought at the peak in 2012, the wait was a long and painful one. Gold did not revisit those highs until the end of 2020, a stretch of over eight years that tested the patience of even the most committed gold investors.
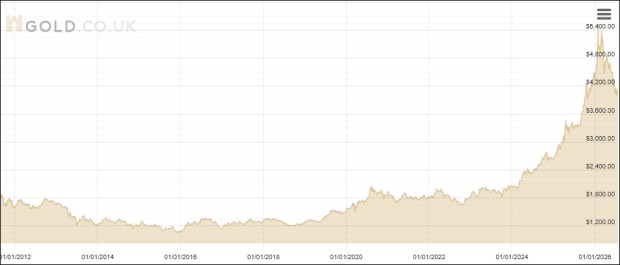
The 15-year chart below shows how gold prices remained underwater, almost dormant over a long period, before shooting up. From $1,700 in July 2011, the price jumped to $4,040, a 135% growth, translating into a CAGR of about 6%.

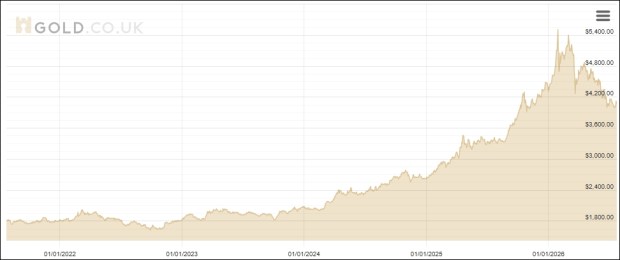
The 5-year chart gets more interesting. Gold was still available around $1,700 as recently as June-July 2021. From that point, it has delivered a 19% CAGR over the last five years, a return that would have made most equity investors take notice.

Overall, some interesting insights emerge:
Between 1996 and 2004, gold barely moved. Prices were largely range-bound for nearly a decade before the real bull run began.
After the sharp 2008-2012 surge, gold visibly plateaued and then drifted lower. The 8-year wait is clearly visible as a flat-to-declining stretch between 2012 and 2020.
The steepest climb is the most recent one. The spike from around 2020 to early 2026 is visually the sharpest over the long period.
Note: All charts from gold.co.uk; as of July 24, 2026
Where Does Gold Go From Here…
How gold prices move from here is anybody’s guess. Advocates of gold see this as the start of a structural bull market. The long-term charts don’t rule that out either, but with several speed breakers along the way.
Billionaire John Paulson, a renowned gold bull, in an interview with CNBC, as reported by Kitco recently, says he believes that gold is in the early stages of a long-term bull market, driven by a loss of faith in paper currencies and strong central bank demand.
When it comes to central banks, the central bankers continue to remain positive on the role of gold in their reserves. All along the recent run, central banks have been a prime driver for gold demand and rising prices.
Despite recent macroeconomic challenges, including the Iran war and rising inflation, official gold reserves of central banks increased by 41 tonnes in May, according to the World Gold Council report.
A cautionary note: at least three times in history, gold has created new peaks and subsequently declined to major lows, falling over 40% in those instances. That makes a case for a downside of around $3,500, from the all-time high price of $5,602.
And, even after falling further, whether gold again enters a dormant phase or restarts its bull run remains to be seen.
For a long-term investor looking for a 10-15% exposure in gold, making a staggered purchase spread out over different periods could be a better approach, rather than trying to time the market.
Disclaimer: This article is for informational purposes only and should not be construed as investment advice. Gold prices are subject to market risks, and past performance is not indicative of future results. Readers are advised to consult a certified financial advisor before making any investment decisions. Financial Express Digital does not take responsibility for any financial losses arising from decisions made based on this article.