


From Japan to America to India, the global stock market is booming, with stock market indices hovering at all-time highs never seen before in equity market history. Investors exposed to the vagaries of a single-nation economy run the risk of getting their portfolio hit by a sudden change of events. Here comes the role of geographical diversification, a strategy for lowering portfolio risk by avoiding overconcentration in any one market.
In an interview with Sunil Dhawan of Financial Express Online, Benedek Voros, Director of Index Investment Strategy at S&P Dow Jones Indices, discusses US stock performance against Indian markets and suggests three reasons for Indian investors to open their portfolios with foreign equities.
But, before that here’s a quick recap of the performance of leading indices in the US and India – (1-year return as of July 5,2024)
Over 30% of the S&P 500 index is concentrated in seven companies while over 20% of SPX is just three stocks – MSFT, NVDA, and AAPL. What does this mean for investors?
S&P Dow Jones Indices aims to measure the markets independently and objectively. In the U.S., there are companies including Microsoft, Nvidia and Apple that currently have a relatively large weight in benchmarks like the S&P 500 because they are relatively large companies, and their weights have increased precisely because their market capitalizations have increased at an above-average rate for an extended period.
Another salient point for Indian market participants is that the largest companies in the S&P 500 are well represented within a sector – Information Technology – in which the Indian equity market is significantly underweight compared to the global equities market.
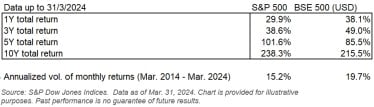
How has the performance of the S&P 500 as against the BSE 500 (INR-Dollar adjusted) over 1 year, 3 years, 5 years and 10 years?
The BSE 500 has outperformed the S&P 500 in the 1 year and 3 years up to March 31, 2024, but underperformed it over 5 years and 10 years. In the 1 year to March 31, 2024, the BSE 500 generated a 38% total return in USD, while the S&P 500 returned 30% over the same horizon.
Over the 10-year horizon, the S&P 500 returned 238% while the BSE 500 clocked up a return of 216%, corresponding to an annualized total return of 9.1% and 8.0%, respectively.
Over the 10 years to March 31, 2024, the monthly returns of the BSE 500 were significantly more volatile than those of the S&P 500: the annualized volatility of monthly returns was 19.7% for the BSE 500 but only 15.2% for the S&P 500.

What are the top 3 reasons Indian market participants should consider the S&P 500 as a long-term strategy?
An analysis of current exposures and historical returns indicates potential advantages when exposure to the S&P 500 is incorporated into an Indian equities portfolio.
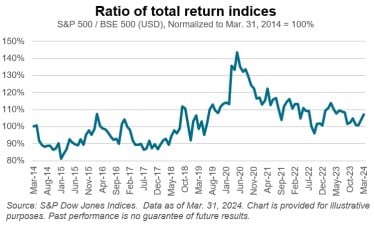
First, combining an Indian equity portfolio with exposure to the S&P 500 provides international diversification, and thus greater stability for a combination portfolio. Although over the 10 years to March 31, 2024, the cumulative total return of the S&P 500 and the BSE 500 ended up being remarkably similar (9.1% vs. 8.0% annualised total return), over shorter time horizons, their performance was usually significantly different, as the below chart suggests.
Consequently, a regularly rebalanced combination portfolio would have benefited from a so-called “rebalance return”, arising from the trading over time to keep weights in their target proportions.

Second, exposure to the S&P 500 captures a significant proportion of the global equity opportunity set outside of India.
According to the OECD, there were about 44,000 listed companies in the world at the end of 2022, with an aggregate capitalization of USD 98 trillion. The S&P Global BMI, which excludes frontier markets, comprises over 14,000 companies with an aggregate market capitalisation of USD 89.9 trillion as of June 28, 2024.
Of the total market capitalization of the S&P Global BMI, the U.S. represents 61.8% as of June 28, 2024, making U.S. equities the natural first step to globalizing their exposures.
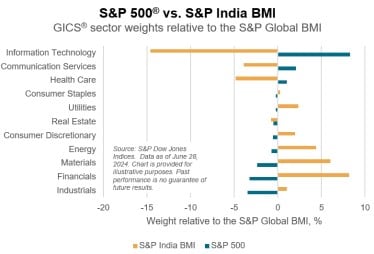
Third, exposure to the S&P 500 could complement a core Indian equity allocation by providing exposure to sectors in the Indian equity markets that are underweight relative to global equities and vice versa. Information Technology, which is the largest underweight in the S&P India BMI relative to the S&P Global BMI, is the largest overweight for the S&P 500. On the other hand, Financials and Materials, which are the largest overweight in the S&P India BMI relative to the S&P Global BMI, are significantly underweighted in the S&P 500.

When the Indian economy is poised to reach greater heights, why should Indians invest in US markets?
The primary goal of diversification for Indian market participants may not necessarily be to pick winners but instead to seek balance, participation, and diversification against idiosyncratic country risk. We are not provided with foresight as to whether the U.S. or the Indian market will achieve higher returns in the future. What we do know is that by investing in U.S. markets, Indian market participants can gain exposure to a market that represents a significant portion of the global opportunity set outside of India, and also has a sector composition that’s complimentary to that of the Indian equity market.
The optimal allocation to international equities is impossible to predict in advance, but historical evidence from around the world has told us that it is unlikely to be zero. Extending from purely domestic equities to a mix of international exposures can achieve a reduction of risk while maintaining or even improving long-term growth prospects.
For Indian investors, U.S. equities can offer an easy route to global diversification as they represent nearly 60% of global equity market capitalization and their sector exposure could complement that of Indian equities. As the U.S. is the world’s largest, most traded, and most watched equity market, the case for a passive approach to gaining exposure is a strong one, evidenced and documented by 20 years of the SPIVA U.S. Scorecards.
Disclaimer: As an independent index provider, S&P DJI’s role is to measure, reflect and represent markets and certain market segments. S&P DJI does not structure, sell, market, or issue any investment products based upon our indices.
Views, recommendations, and opinions expressed are personal and do not reflect the official position or policy of FinancialExpress.com. Readers are advised to consult qualified financial advisors before making any investment decision. Reproducing this content without permission is prohibited.