


")
The previous Global Insight Piece, ‘We Don’t Need No Foreign Investor’ did incite a lot of discussion and I received many queries, feedback and comments.
The piece, of course, was about the continued selling by foreign investors in the Indian public equity markets, over the last year, the last three years and more. At the same time, the faithful buying through Systematic Investment Plan (SIP) by the Indian retail investor, has ensured that the cumulative inflows in equities since 2003 by domestic mutual funds has surpassed those of foreign portfolio investors.

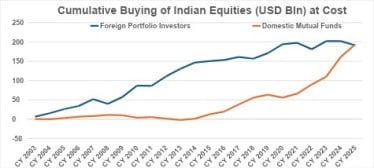
This data is at cost and not at market value
‘We Don’t Need No Foreign Investor’!
Foreign investors still matter to the Indian markets, they own ~17% of the broader Indian equity markets, but their impact on share prices is not what it used to be a decade ago.
Over the past few editions, I have discussed why foreign investors are not investing as much as expected. I laid out few reasons: profit booking existing investments due to India’s relative outperformance, concerns about slower economic and earnings growth, India’s relative over-valuation, and the general lack of large net flows into emerging markets.
In this piece, I focus on the last point, the slowdown in overall net flows into emerging market equities over the last decade.
Global Investors are not allocating as much to Emerging Markets
In Foreign Investors are under-invested by more than a trillion dollars, I illustrated using two simple triangle images, how global investors allocate their capital. First, by asset class– Fixed income, Equities and Alternatives. And then by regions. A large share is invested in the home country. Global Investors then diversify into other global developed markets. The allocation to emerging markets is a small part of the overall pie for a global investor. India is an emerging market (EM) or developing economy.

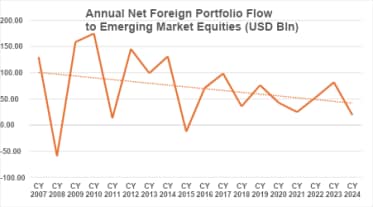
As shown in this downward sloping chart, annual foreign portfolio inflows into all Emerging Market equity markets have declined from an average of ~>USD 100 billion to ~USD 50 billion.
On a cumulative basis, EM Equities saw USD 1,380 billion in total flows since 2007. Indian equities over the same period, saw USD 168 billion in net flows, ~12% of total EM flows.
There are years, like 2020, where India received over 50% of EM flows. And there are years when India saw outflows despite EMs overall seeing net inflows.
As India’s weight in the MSCI Emerging Market Index has increased overtime from ~7% to ~20%, India’s share in EM flows has risen. One should expect that India will receive on an average about ~20% of overall EM equity flows.
Emerging Markets have Under-performed; India bears the brunt by out-performing!
As you notice, flows to India from global investors are constrained by how investors feel about allocating to EMs in general. For instance, if portfolio equity flows to EMs were to be USD 150 billion per year, India should technically stand to receive USD 30 billion per year in equities from global investor allocation. The only calendar year India received equity portfolio of amount was in 2010!
Thus, despite India’s relative outperformance, we did not see as much allocations as expected. In fact, as we have noted, given the outperformance, India has seen net outflows, as investors have rotated out of India to other markets given that the overall pie is not growing by much.
Given the continued underperformance of Emerging Market equities against Developed markets, global investors are doing the right thing by allocating lesser than intended to EM equities. However, by bracketing allocations into such buckets, global investors remain under-weight in EM and hence remain under-weight in India. Global Investors are thus missing out on India’s growth story which is reflected in Indian public equities.
Global or EM allocation dominate foreign ownership in India.
I estimate ~20% to be India dedicated flows.
Looking at the category of foreign investors, who own Indian equities makes it clear.

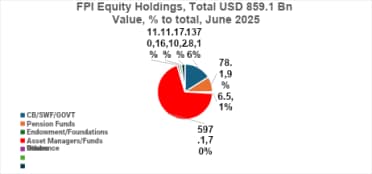
My categorisation shows that Asset Managers/Funds dominate the ownership with 70% of overall holding. Data sourced from Bloomberg, by my firm Quantum Advisors, shows offshore domiciled India dedicated equity funds total to about ~USD 130 billion in Assets under Management. This suggest that ~22% of Asset Manager/Fund category invested in India are through India dedicated equity funds. The rest are India allocation made by funds which have a global, emerging market, Asia… focus.
The second largest owner category are those whom I have clubbed as Central Bank (CB), Sovereign Wealth Fund (SWF), and Government (GOVT) with USD 137.8 billion and 16% share.
As with the asset managers/funds category, I think a similar estimation of ~20% of flows by SWF, Pensions, Endowments, Insurance companies as India dedicated would be reasonable.
I thus estimate that, India dedicated investments whether through Funds, direct investing or managed by investment managers like my firm, Quantum Advisors, would be about ~USD 200 billion, ~23% of total foreign ownership.
The rest of the allocation is through global/EM/Asia or other regional Funds or Mandates.
We believe India dedicated allocations will rise as India’s share in global GDP and Market cap keeps rising.
As we see an increase in India dedicated Investments, flows to India should increasingly be determined by India’s prospects, governance, rule of law, attractiveness, growth, ease of entry and exit, taxation policies and other local factors.
Flows to India from global investors then need not be constrained by overall flows to Emerging Markets or on global generic asset allocation trends.
Arvind Chari is a Chief Investment Strategist and has been with Quantum Advisors India group since 2004. Arvind has over 20 years of experience in long-term India investing across asset classes. Arvind is a thought leader and guides global investors on their India allocation.
This article is for educational and discussion purposes only and is not intended as an offer or solicitation for the purchase or sale of any investment in any jurisdiction. No advice is being offered nor recommendation given and any examples are purely for illustrative purposes. The views expressed contain information that has been derived from publicly available sources that have not been independently verified. No representation or warranty is made as to the accuracy, completeness, or reliability of the information.
The views and opinions expressed in this article are my personal views and should not be construed of the Firm. There is no assurance or guarantee that the historical result is indicative of future results, and the future looking statements are inherently uncertain and cannot assure that the results or developments anticipated will be realized.


