


")
As the festive lamps light up homes across India, another bright metal is stealing the limelight, Silver. The glittering metal, often overshadowed by its golden cousin, has now become the talk of every trader’s chatroom, jeweller’s counter, and investor’s mind.
The price of Silver has rallied to an all-time high of $54.46 per ounce in the US markets and Rs. 1,70,415 per kg on MCX in India.
While the festive season naturally fuels the demand for silver, especially in Indian households, what’s truly driving this current rally is something far more emotional and psychological – FOMO, the fear of missing out.
Can Silver cross Rs. 2,00,000/kg in India?
Before we answer that, let’s travel back in time and understand how Silver has behaved in the past, because, as Indian traders often say, “Bhav Bhagwan Che.”
The historical saga: US Silver quarterly chart
Silver’s history is filled with drama, speculation, manipulation, and moments of euphoria. From the 1970s to now, it has been through cycles of greed and fear that mirror human psychology itself.

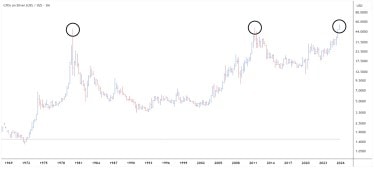
1980 – The Hunt Brothers’ Silver Saga
In the late 1970s, two wealthy American brothers, Nelson Bunker Hunt and William Herbert Hunt, decided to corner the silver market. Believing that inflation and declining trust in paper money would drive precious metals higher, they began aggressively buying silver, not just contracts, but physical bars, too. Their goal was to control the global silver supply.
By early 1980, the Hunt brothers reportedly controlled almost one-third of the world’s deliverable silver, sending prices soaring to nearly $48 per ounce, a massive rally from under $6 just a few years earlier.
But the U.S. government and COMEX intervened, introducing new margin rules and limits on silver purchases. What followed was chaos. Silver prices crashed, the brothers faced financial ruin, and what the world remembers today as the “Silver Thursday” crash became a case study in speculative excess.
2011 – The Fakeout After 31 Years
Fast forward to 2011, when silver once again touched its 1980 highs, reaching $49.83 per ounce after 31 long years.
But it turned out to be a fakeout on the charts. Silver prices collapsed from $49.83 to $26 within months, triggering multiple lower circuits, and eventually bottomed near $13.75 over the next few years. It was a painful reminder that parabolic rallies rarely end well.
2025 – Above $50 Again
Now, after more than a decade, Silver has again crossed the $50 mark, making a high of $54.46. A reality check in the Friday’s session made traders think twice before investing as prices corrected 7% from the peak but still managed to close above $50, a crucial psychological level.
In India, MCX Silver mirrored had a similar move, touching Rs. 1,70,415 before correcting to a low of Rs. 1,53,700, nearly a 10% dip.
Déjà Vu: Memories from 2011
I still remember the mood back in 2011. Silver was buzzing around Rs. 71,000 per kg, and the chatter in trading circles was about it touching Rs. 1,00,000. Physical demand was so intense that jewellers were charging a 10% premium over spot prices.
Interestingly, the atmosphere feels similar this time. Physical demand is once again red-hot, not just in jewellery shops, but also in digital silver products. The surge has been so intense that AMCs managing Silver Fund-of-Funds (FoFs) had to pause fresh investments due to a demand-supply mismatch.
And yet, the recent 10% fall from the top brings back those memories, the sudden correction that started the long unwinding in 2011. But markets rarely repeat history in the same way; they often rhyme. Let’s see whether this is just a dip or the start of a top formation.
Technical Lens
Switching from emotions to charts, the weekly Heikin Ashi candles tell a powerful story.
MCX Silver Heikin Ashi Weekly Chart

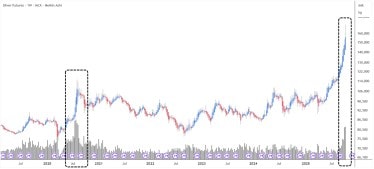
Since June 2025, MCX Silver has been on an uptrend without a single bearish Heikin Ashi candle appearing on the weekly chart, a sign of strong bullish trend as per the trend pattern of Heikin Ashi.
As per the Heikin Ashi candles, the lowest low of the last two weekly candles stands at Rs. 1,37,408. This acts as a panic button for the bulls.
What strengthens this observation is the spike in trading volumes. The last two weekly candles recorded the highest volume since 2020, the same period when Silver hit Rs. 1,15,176 and then sharply corrected to Rs . 76,568. Historically, such volume surges near highs often mark inflexion zones where big hands are active, either accumulating or distributing.
Since India’s MCX prices move in tandem with the US COMEX Silver, global levels hold the key. Using the same Heikin Ashi principle, the $45 per ounce level emerges as the international make-or-break zone.
If Silver holds above $45, the bulls might retain control, potentially leading to another leg higher above $60, which could potentially translate into Rs. 2,00,000 per kg on MCX, given the current currency and premium dynamics.
But if $45 breaks decisively, the euphoric rally might turn into a consolidation or even a correction phase, much like 2011.
For now, traders should watch Rs.1,37,408 on MCX and $45 on COMEX as the key reversal levels.
Silver’s journey toward Rs. 2,00,000 will not just depend on global trends but also on how Indian investors balance between fear and greed.
Disclaimer:
Note: The purpose of this article is only to share interesting charts, data points and thought-provoking opinions. It is NOT a recommendation. If you wish to consider an investment, you are strongly advised to consult your advisor. This article is strictly for educative purposes only.
Brijesh Bhatia is an Independent Research Analyst and is engaged in offering research and recommendation services with SEBI RA Number – INH000022075. He has two decades of experience in India’s financial markets as a trader and technical analyst.
Disclosure: The writer and his dependents do not hold the stocks discussed here.
The website managers, its employee(s), and contributors/writers/authors of articles have or may have an outstanding buy or sell position or holding in the securities, options on securities or other related investments of issuers and/or companies discussed therein. The content of the articles and the interpretation of data are solely the personal views of the contributors/ writers/authors. Investors must make their own investment decisions based on their specific objectives and resources, and only after consulting such independent advisors if necessary.


