


Bihar Election 2025: Bihar was once seen as the underdog of the Indian economy. However, it has shown a tremendous economic turnaround in the past two decades. The journey though has not been a smooth one. While the state’s progress has come through a mix of reforms, the gains of it have not been equal for everyone. And as reports like the Bihar Economic Survey and RBI data show, the growth is indeed real, but so are the obstacles.
Lalu’s Jungle Raaj (1990-97): When growth stalled – Inside Bihar’s ‘Bimaru’ years
Bihar’s economy struggled for more than a decade under the rule of Lalu Prasad Yadav. He served as the Chief Minister of the state from March 1990 to July 1997. Post this, his wife Rabri Devi took over the position until November 2005, but Bihar was still under Lalu’s influence, which effectively extended his political dominance over the state during this period.
The GDP growth rate remained extremely slow, with little progress in industry and infrastructure sectors. Naturally, this situation left the state trailing far behind the rest of India. Poor development, weak governance, and slow investment contributed to mounting economic problems, and the state became widely known as the “Bimaru” state, a term that was then used for regions that were considered financially weak. The 15 years under their leadership marked one of the slowest growth phases in Bihar’s modern history.
It’s not like there was no expenditure being made towards the development of the state. Let’s for example take the year 1993-94. According to the data provided by the Planning Commission of India, for the year 1993-94, the total outlay for Bihar, as part of the eighth 5 year plan, was Rs 2,30,00. In the same year, the outlay for education, rural health, rural water supply, rural sanitation, and rural housing was Rs 1,02,99, Rs 6711 lakhs, Rs 7548 lakhs, Rs 300 lakhs, and Rs 556 lakhs respectively.
But from the outlay that was provided, the development that was carried out, did not match. And this can be clearly seen from the graph below.

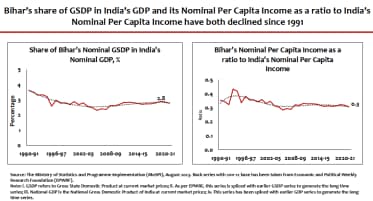
The graph shows two key economic indicators for Bihar from 1990-91 to 2020-21. Here’s a simplified breakdown:
1. Share of Bihar’s Nominal GSDP in India’s Nominal GDP
1990-91: Approximately 4.5%
1996-97: Around 3.5%
2002-03: Roughly 3.0%
2008-09: About 2.8%
2014-15: Around 2.8%
2020-21: Stable at approximately 2.8%
Trend: The share dropped sharply from 4.5% in 1990-91 to around 2.8% by the early 2000s and has remained relatively flat since then.
2. Bihar’s Nominal Per Capita Income as a Ratio to India’s Nominal Per Capita Income
1990-91: Approximately 0.45 (45% of India’s per capita income)
1996-97: Around 0.35 (35%)
2002-03: About 0.30 (30%)
2008-09: Roughly 0.25 (25%)
2014-15: Around 0.30 (30%)
2020-21: Approximately 0.30 (30%)
Trend: The ratio fell from 0.45 in 1990-91 to a low of about 0.25 in the late 2000s, with a slight recovery to 0.30 by 2020-21.
So in hindsight, the most notable decline occurred between Lalu’s era, that is the early 1990s and early 2000s, with little improvement thereafter.
The state of Bihar’s economy when Lalu’s wife, Rabri took over (1997–2005)
So as is clear from the data above, Bihar’s economy seemed stuck in the late 90s. When Rabri became the state’s chief minister in 1997, it was already infested with scandals like the fodder scam. Many saw her rule as an extension of Lalu’s influence. During her time in power, a variety of media outlets reported that Bihar saw very little industrial growth, and that its infrastructure continued to weaken. The situation became worse in 2000, when Jharkhand was carved out of Bihar, taking away most of the state’s mineral and industrial resources.
The economy remained heavily dependent on farming, with people’s average income growing much slower than the rest of the country. The government faced strong criticism over corruption, poor governance, and rising crime, which led many to call that period as “jungle raj,” a phrase often used to describe lawlessness and disorder.
According to the ‘Macro and Fiscal Landscape of the State of Bihar’ by NITI Aayog, Bihar’s income was among the lowest in the country, with its Gross State Domestic Product (GSDP) standing at just about Rs 47,591 crore in 2005-06. On an individual level, people earned very little, barely Rs 3,524 a year on average. Growth too was sluggish, with the economy crawling at just 2.9% a year between 2001 and 2005. Compared to other states, Bihar was far behind, struggling to shake off its image as one of India’s poorest regions.
The state’s economy was clearly limping. Rabri’s era wasn’t all doom, but growth remained stagnant, setting a low bar for what came next.
Under Nitish Kumar, Bihar’s economy found its feet, yet the climb remained steep
As per the official Bihar Economic Survey reports and related government statistics from 2005 to 2010, the initial years of Nitish Kumar’s rule show that the state’s economy picked up speed after he took over in 2005.
In 2009-10, the state’s GSDP at then current prices was Rs 1,72,138 crore, and the per capita income was Rs 17,959. At the time, the national per capita average was about three times higher, which means that while an average person in Bihar earned around Rs 18,000 in a year, someone in the rest of India was, on average, earning close to Rs 54,000 in the same year.
Just a few years earlier, in 2004-05, the GSDP was only Rs 75,608 crore, with people earning about Rs 8,528 on average. Bihar’s Finance Minister and Deputy Chief Minister SK Modi had pointed out that between 1999-2000 and 2004-05, under Rabri’s rule, Bihar’s economy grew slowly at about 3.5% a year.
But after Nitish, from 2004-05 to 2010-11, the growth rate shot up to nearly 11%. After the survey was completed, the state’s statistics department had shared updated figures. As per these, Bihar’s GSDP in 2009-10 was Rs 1,68,603 crore, and the per capita income was Rs 17,590, which was still only about one-third of the national average.

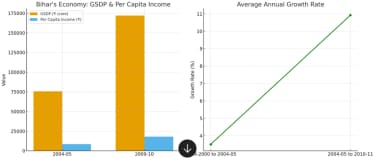
Above you can see the AI-generated graph showing the statistics of Bihar’s economic jump.
The left side compares GSDP and per capita income in 2004-05 and 2009-10. While, the right side highlights the sharp rise in average annual growth rate, from 3.5% before 2005 to nearly 11% after.
Bihar’s Economic Turnaround
According to the Planning Commission of India, during Nitish Kumar’s last terms as Chief Minister, Bihar saw some of its best economic growth. In 2006-07, 2008-09, 2010-11, and 2011-12, the state recorded growth rates of 17.7%, 14.5%, 14.7%, and 13.1% respectively. Between 2005-06 and 2010-11, the average growth stood at 10.93%. But in 2015-16, the growth rate dropped sharply by 7.6%. Since then, his third term in office has struggled with slower growth.
The Covid-19 pandemic hit Bihar’s economy further, with the Gross State Domestic Product falling by 2.5% in 2020-21. In the past five years, growth in the primary sector was 2.3%, the secondary sector 4.8%, and the tertiary sector 8.5%. In 2020-21, Bihar’s per capita income was Rs 55,055, while the national average was Rs 86,659.
According to a recent report by industry body CII, Bihar’s economy is expected to touch $1.1 trillion by 2046-47 if the state uses its full potential. In the short term, the state’s economy could more than double to $219 billion by 2030-31 in a positive growth scenario. The report highlights Bihar as an attractive destination for investors, thanks to its fast-changing economy, young population, and supportive policies.
Bihar is currently among the fastest-growing states in India. In 2023-24, its GSDP was Rs 8.54 lakh crore, growing at 14.4% at current prices, which is higher than the national growth rate of 12% in the same year.