


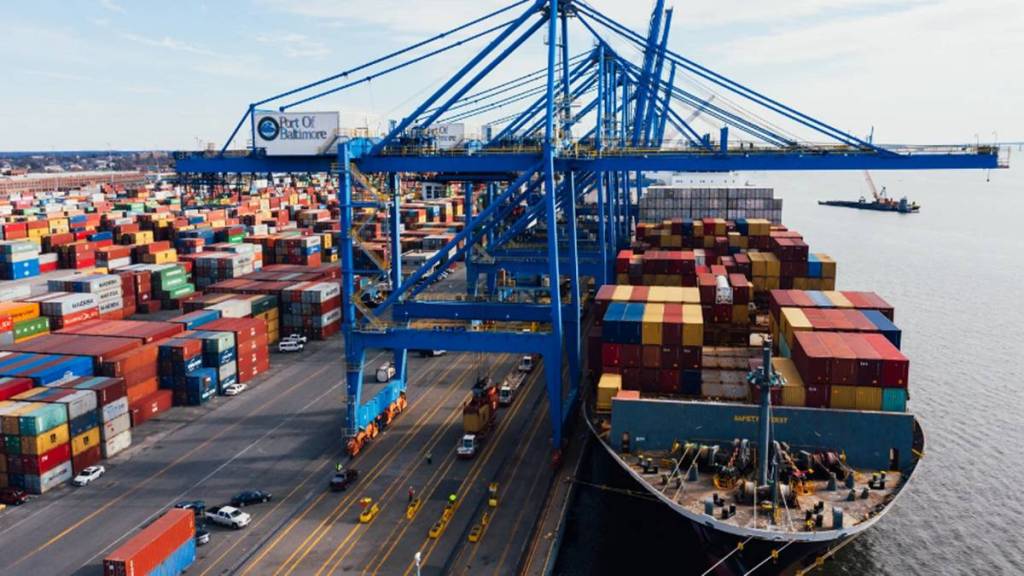

India’s merchandise exports surged 26% in August, with the first five months of FY27 reflecting an underlying momentum. But its import bill too is rising. So, policy should not merely focus on the size of the trade deficit, but on whether imports are strengthening India’s productive capacity, explains Ajay Sahai
Is there an export momentum?
The encouraging part in the August numbers is not merely the 26.1% increase in merchandise exports to $43.81 billion, but the breadth of the growth. Electronics surged 89.8%, petroleum products 63.3%, engineering goods 24.9%, marine products 27.8%, chemicals 16.4%, and meat, dairy, and poultry 37.1%. More importantly, even after excluding petroleum products and gems and jewellery (two categories that can greatly influence the headline number) exports rose from $28.26 billion to $34.68 billion. It suggests a reasonably broad-based underlying momentum. The cumulative data reinforce the trend.
Merchandise exports during April-August FY27 reached $215.91 billion, up 17.85%, while overall exports of goods and services are estimated at $399.27 billion, up 15.55%. So, while one shouldn’t read too much into a single month, the first five months suggest a growing export momentum.
Engineering, electronics, and petroleum products are providing much of the momentum, but electronics is perhaps the most interesting structural story. Engineering goods reached $12.32 billion in August, while electronics exports almost doubled to $5.55 billion.
During April-August, engineering exports touched $58.70 billion, up 19.55%, while electronics reached $26.66 billion, growing nearly 40%. Petroleum product exports also grew 39.43% during the first five months. The rapid growth in electronics points to a gradual shift in our export basket towards higher-value manufactured products. At the same time, growth in chemicals, plastics, marine products, handicrafts, and processed food suggests wider export expansion.
Is India succeeding in finding new markets?
The US remains India’s largest export market, and saw 21.83% growth in August. But the fastest growth is coming from non-traditional markets. Exports to Singapore rose 160.96%, Spain 196.47%, Tanzania 214.52%, Malaysia 84.43%, Japan 80.66%, China 52.35%, and South Africa 45.62%. During April-August, exports to Tanzania rose 129%, Singapore 96.56%, Sri Lanka 93.13%, Malaysia 75.4%, South Africa 58.23%, Spain 54.85%, and Japan 42.55%. With tariffs and geopolitical uncertainties affecting trade, India needs multiple engines of export growth.
Geographic shift in export & weak spots
It would be premature to suggest that India’s dependence on traditional markets has materially declined (the US accounts for $8.32 billion of exports in August and $42.79 billion in April-August). What is changing is the geography of incremental growth. Markets like Tanzania, South Africa, Malaysia, Sri Lanka, Spain, and Japan are expanding much faster, albeit from smaller bases. The next phase of diversification should thus be about scale. The real success will come when markets where India exports $500 million or $1 billion worth of goods turn into multi-billion-dollar destinations.
The export picture is not uniform. In April-August, tea exports fell 15.62%, tobacco 17.49%, fruits and vegetables 10.29%, ceramic products and glassware 21.56%, and ready-made garments of textiles 9.10% in dollar terms. These underline why export strategy can’t be based only on countries or headline growth, but a sharper product-market matrix.
Rising import bill and its outcome
Merchandise imports increased 14.07% in August to $70.67 billion and 18.21% during April-August to about $363 billion. A sizeable portion of the increase is concentrated in energy, raw materials, intermediates, machinery, and technology-related products. Such imports can also accompany stronger manufacturing activity, capacity creation, and investment. Therefore, every dollar of additional imports should not automatically be viewed as additional consumption or economic weakness.
There are indications that rising imports are positively impacting domestic manufacturing and investment. During April-August, imports of machinery (electrical and non-electrical) went up 15.77% to $28.46 billion, professional and optical instruments rose 17.18%, transport equipment 7.12%, machine tools 5.07%, and electronics 43.57% to $66.48 billion. Industrial inputs have also risen sharply. A meaningful part of the increase in imports appears to be linked to the requirements of the domestic economy rather than simply a surge in final consumption.
How to interpret import basket
The composition of imports deserves as much attention as the overall number. Gold imports fell sharply by 57.75% in August. Iron and steel imports fell 11.69%, pulp and waste paper 13.83%, newsprint 10.85%, textile yarn, fabrics, and made-ups 8.12%, medicinal and pharma products 7.90%, and wood products 3.17%. The trend in iron and steel is especially noteworthy because imports were also down 4.78% cumulatively in dollar terms. Pearls and precious and semi-precious stones declined 11.39% during April-August as well.
Contrast this with the sharp rise in machinery, electronics, non-ferrous metals, and industrial minerals, and a more nuanced picture emerges. India’s import bill is rising, but its composition is also changing. The policy focus should thus be not merely on the size of the trade deficit, but on whether imports are strengthening India’s productive capacity, supporting exports and investment, or primarily feeding final consumption.
The writer is Director General & CEO, Federation of Indian Export Organisations