


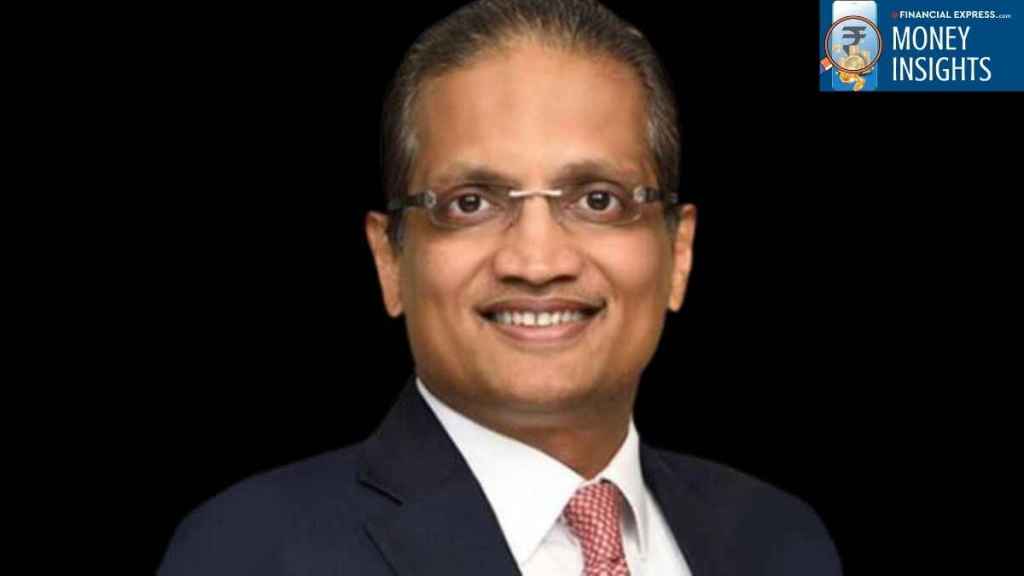

Prashant Khemka, a veteran in the ever-evolving world of finance and investments, has had an illustrious career. A mechanical engineer, he has gone on to become one of India’s money managers. His story is one of a mechanical engineer who transitioned to equities.
A chess enthusiast, Khemka has demonstrated a sharp, astute approach to investing, earning several awards, including an AAA rating from Citywire and an Elite rating from Fund Calibre.
Before founding White Oak Capital Management in June 2017, he led GS India Equity at Goldman Sachs Asset Management (GSAM) as MD, CIO & CEO for over a decade, and led Global Emerging Markets (from June 2013 to March 2017).
He launched the Goldman Sachs India Equity strategy in 2007 with just US $5 million in seed capital. By the time he transitioned out, he had scaled GSAM’s India Equity and Global Emerging Markets (GEM) businesses to US $6.0 billion in assets, driven largely by strong performance.
After managing institutional money within a global investment bank structure, Khemka built an independent, performance-centric asset manager with a single-minded focus on stock selection and long-term capital compounding. What went in was deep research and an investment philosophy backed by a robust investment process & systems, aimed at mitigating risk and generating alpha or outperformance for investors.
WhiteOak Capital’s India-dedicated PMS strategies also outperformed the BSE 500 – Total Return Index (TRI) and attracted high-net-worth investors.
In November 2021, with the acquisition of YES Asset Management (India) Limited and YES Trustee Ltd., Khemka’s WhiteOak Capital transitioned into full-scale retail asset management with WhiteOak Mutual Fund. The investment team, operating under Khemka’s structural investment philosophy (namely “opco-finco”), scaled its total assets under management.
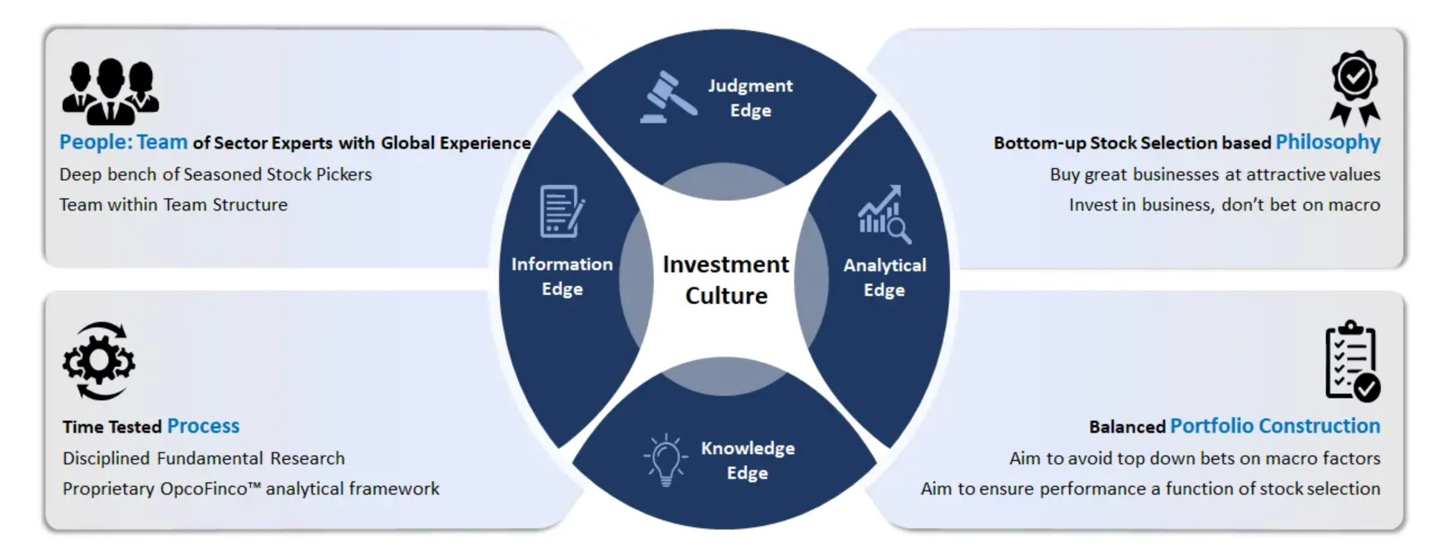
What differentiates Khemka-led WhiteOak Capital is its bottom-up, cash-flow-based valuation framework and well-balanced, diversified approach focused on selecting stocks with the potential to deliver alpha while managing long-term volatility, while consciously avoiding top-down macro bets, market timing, or sector rotation, which add little or no value.
WhiteOak Capital’s Focused Investment Culture
“Opco-Finco” valuation framework: Khemka’s Investment Engine
Opco-Finco is at the cornerstone of WhiteOak Capital. What it essentially does is distinguish between operational companies and financial structures.
‘Opco’ refers to the actual, day-to-day business operations — such as factories, intellectual property, human capital, brand value, etc.– as well as the operating liabilities.
‘Finco’, on the other hand, represents and assesses how the business is funded (debt-to-equity), the net debt of the company, cash flows, etc.
A structured screening process assesses a company’s governance DNA as a starting point for the research process. What it does, among other things, before going through the financials, is:
- Meeting company management
- Visiting plants (in case of a manufacturing company)
- Understanding who the competitors are
- Trade participant
- Who the suppliers and the ultimate consumers are
This provides a comprehensive 360-degree view of the business, and a bottom-up approach to stock picking is followed.
Khemka’s asset management company is very conscious of valuations. He believes it is possible to earn outsized returns over time by investing in great businesses at attractive values.
Khemka’s WhiteOak Capital prefers investing in companies with strong or improving fundamentals and approaches them when they are trading at a substantial discount to their intrinsic value.
Moreover, the valuation framework is based on economic cash flows rather than distorted accounting earnings. Khemka’s WhiteOak Capital does not look at merely price-to-equity (PE) or enterprise value-to-gross operating profit (EV/EBITDA) for valuations, as they blend operations and capital structures together, often creating a distortion.
For example, a company with high cash on its balance sheet will show a falsely high P/E ratio, making it look expensive when it may be cheap because its core business (Opco) is being undervalued. Similarly, a highly leveraged company may appear cheap on PE, while hiding the integral risk in the capital structure.
In the stock selection process, besides the greatness of the business, weightage is also given to:
- Upside potential
- Market capitalisation
- Liquidity.
Overall, Khemka’s firm believes investing is both an art and a science. The art is the investment team’s skills, ultimately backed and executed through investment science.
Is Khemka’s Opco-Finco Investment Philosophy Rewarding Mutual Fund Investors?
The data shows that out of the mutual fund schemes that have completed a 3-year performance track record, the three that rewarded investors handsomely by generating alpha, i.e. significantly beating their respective benchmarks, are as follows:
- WhiteOak Capital Flexi Cap Fund
This flagship scheme launched in August 2022 with a versatile investment mandate to invest dynamically across large-caps, mid-caps, and flexi-caps – without any upper or lower limits– today manages assets of over Rs 9,100 crore and has delivered a compounded average growth rate (CAGR) of 13.7% over the past 3 years and 16.4% since its launch.
As of 15 September 2026, these returns are higher than the benchmark BSE 500 TRI, which clocked around 9% CAGR over 3 years and, since the fund’s launch, around 11.3% CAGR.
Moreover, the WhiteOak Capital Flexi Cap Fund has outperformed the category median over the past 3 years by 3.2%.
Report Card of WhiteOak Capital Flexi Cap Fund
| Absolute Returns (%) | CAGR (%) | |||
| 6 Mths | 1 Yr | 3 Yrs | Since Inception | |
| WhiteOak Capital Flexi Cap Fund | 12.4 | 2.6 | 13.7 | 16.4 |
| Category Median | 10.0 | 0.3 | 10.5 | — |
| BSE 500 TRI | 5.6 | -2.6 | 9.0 | — |
The returns data is as of 15 September 2026.
Source: Value Research
What matters is that it has delivered returns while keeping risk in check. The fund’s standard deviation (SD) of 14.3% is lower than the BSE 500 TRI (15.2%) and the category median (15.3%). On a risk-adjusted basis, the fund has compensated investors well (Sharpe and Sortino ratios of 0.74 and 0.98, respectively), higher than some category peers.
WhiteOak Capital Flexi Cap Fund: Risk and Risk-adjusted Returns
| Std Dev (%) | Sharpe Ratio | Sortino Ratio | |
| WhiteOak Capital Flexi Cap Fund | 14.3 | 0.74 | 0.98 |
| Category Median | 15.3 | 0.57 | 0.69 |
| BSE 500 TRI | 15.2 | 0.45 | 0.58 |
All other risk measures have been calculated using calendar month returns for the last three years.
The data is as of 31 August 2026.
Source: Value Research
In the last eight-and-a-half months or so (from 1 January 2026 to 15 September 2026), which has proved to be a volatile period for the market due to the West Asia war, WhiteOak Capital Flexi Cap has managed to deliver 0.3% absolute returns, versus -5.5% delivered by the BSE 500 TRI. Even flexi-cap behemoths such as Parag Parikh Flexi Cap and HDFC Flexi Cap clocked -5.9% and -3.1%, respectively, during this period.
WhiteOak was able to pull this off mainly due to a higher allocation to large-caps. Allocation to large private banks such as HDFC Bank, ICICI Bank, and SBI, along with other heavyweights, provided better downside protection. Moreover, a diversified portfolio of 160-165 stocks helped.
Currently, the fund holds 164 stocks, with 58% in large-caps, 32% in small-caps, and around 10% in mid-caps. The top 10 stocks make up about 34% of the portfolio and include names such as ICICI Bank, Bharti Airtel, Nestle India, HDFC Bank, and SBI, among others.
Top Holdings of WhiteOak Capital Flexi Cap Fund
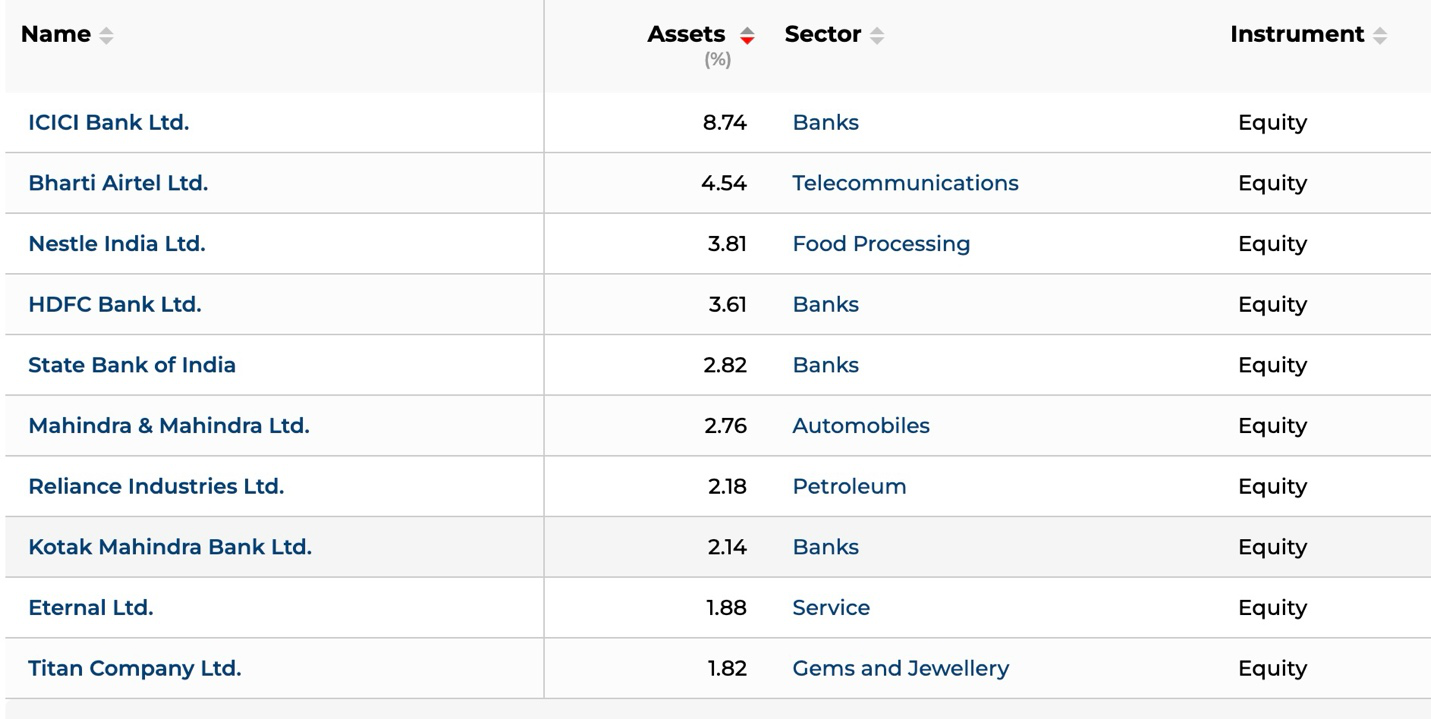
By sector, the top sectors are financials (30.9%), services (9.8%), and capital goods (7.6%), comprising 48.3% of the portfolio.
Also, WhiteOak Capital’s value-conscious approach is reflected in the fund’s portfolio PE and price-to-book (PB) ratios of 25.8x and 3.6x, respectively.
- WhiteOak Capital Mid Cap Fund
This scheme, launched in September 2022, has seen its asset base grow to over Rs 7,400 crore with investors chasing mid-caps.
Over the past 3 years, WhiteOak Capital Mid Cap Fund has clocked an appealing 21.0% CAGR and, since its inception, 22.9% CAGR.
In comparison, over the 3-year period, the benchmark, BSE 150 MidCap TRI, clocked 14.1%, and since the fund’s inception in September 2022, 16.9%. In other words, the fund has maximised alpha for investors and outperformed its benchmark.
Moreover, the fund has outperformed the category median of 16.2% over the past 3 years. Its 21% CAGR over 3 years is higher than HDFC Mid Cap Fund (16.4%), a behemoth in its category (with AUM of over Rs 1.08 lakh crore) and even Quant Mid Cap Fund (10.1%), a similar-sized fund (with AUM of over Rs 8,000 crore)
Report Card of WhiteOak Capital Mid Cap Fund
| Absolute Returns (%) | CAGR (%) | |||
| 6 Mths | 1 Yr | 3 Yrs | Since Inception | |
| WhiteOak Capital Mid Cap Fund | 19.5 | 11.9 | 21.0 | 22.9 |
| Category Median | 13.4 | 5.0 | 16.2 | — |
| BSE 150 MidCap TRI | 11.5 | 2.5 | 14.1 | — |
The returns data is as of 15 September 2026.
Source: Value Research
While delivering the returns, the fund has not exposed investors to unduly high risk. In fact, its standard deviation (at 16.9%) is lower than the category median (17.8%) and the benchmark, the BSE 150 MidCap TRI. On a risk-adjusted basis, WhiteOak Capital Mid Cap ranks second, with Sharpe and Sortino ratios of 1.01 and 1.32, respectively.
WhiteOak Capital Mid Cap Fund: Risk and Risk-adjusted Returns
| Std Dev (%) | Sharpe Ratio | Sortino Ratio | |
| WhiteOak Capital Mid Cap Fund | 16.9 | 1.01 | 1.32 |
| Category Median | 17.8 | 0.75 | 0.96 |
| BSE 150 MidCap TRI | 17.8 | 0.66 | 0.86 |
All other risk measures have been calculated using calendar month returns for the last three years.
The data is as of 31 August 2026.
Source: Value Research
Despite the intense volatility due to boiling tensions in West Asia, WhiteOak Capital Mid Cap has clocked 8.5% absolute returns in the last eight-and-a-half months or so (as of 15 September 2026), which is higher than the BSE 150 MidCap TRI (0.9%) and the mid-cap funds category average (3.1%). The key reason behind this is portfolio construction. Top holdings have rarely exceeded a 2.5- 3.1% weight in the portfolio, and the fund uses tactical hedges (index derivatives). Moreover, the fund’s diverse portfolio of over 130 stocks has helped. Stock picks such as Coforge, Persistent Systems, PB Fintech, Max Financial Services, and Laurus Labs, among others, have delivered strong operational earnings relative to speculative momentum stocks that dragged down the broader BSE 150 MidCap index.
The fund currently holds 143 stocks, with 70% allocated to mid-caps, 24% to small-caps, and 6% to large-caps. The top 10 stocks account for about 24% of the total portfolio and include names such as Max Financials, Coforge, Bharti Hexacom, Federal Bank, and PB Fintech, among others.
Top Holdings of WhiteOak Capital Mid Cap Fund
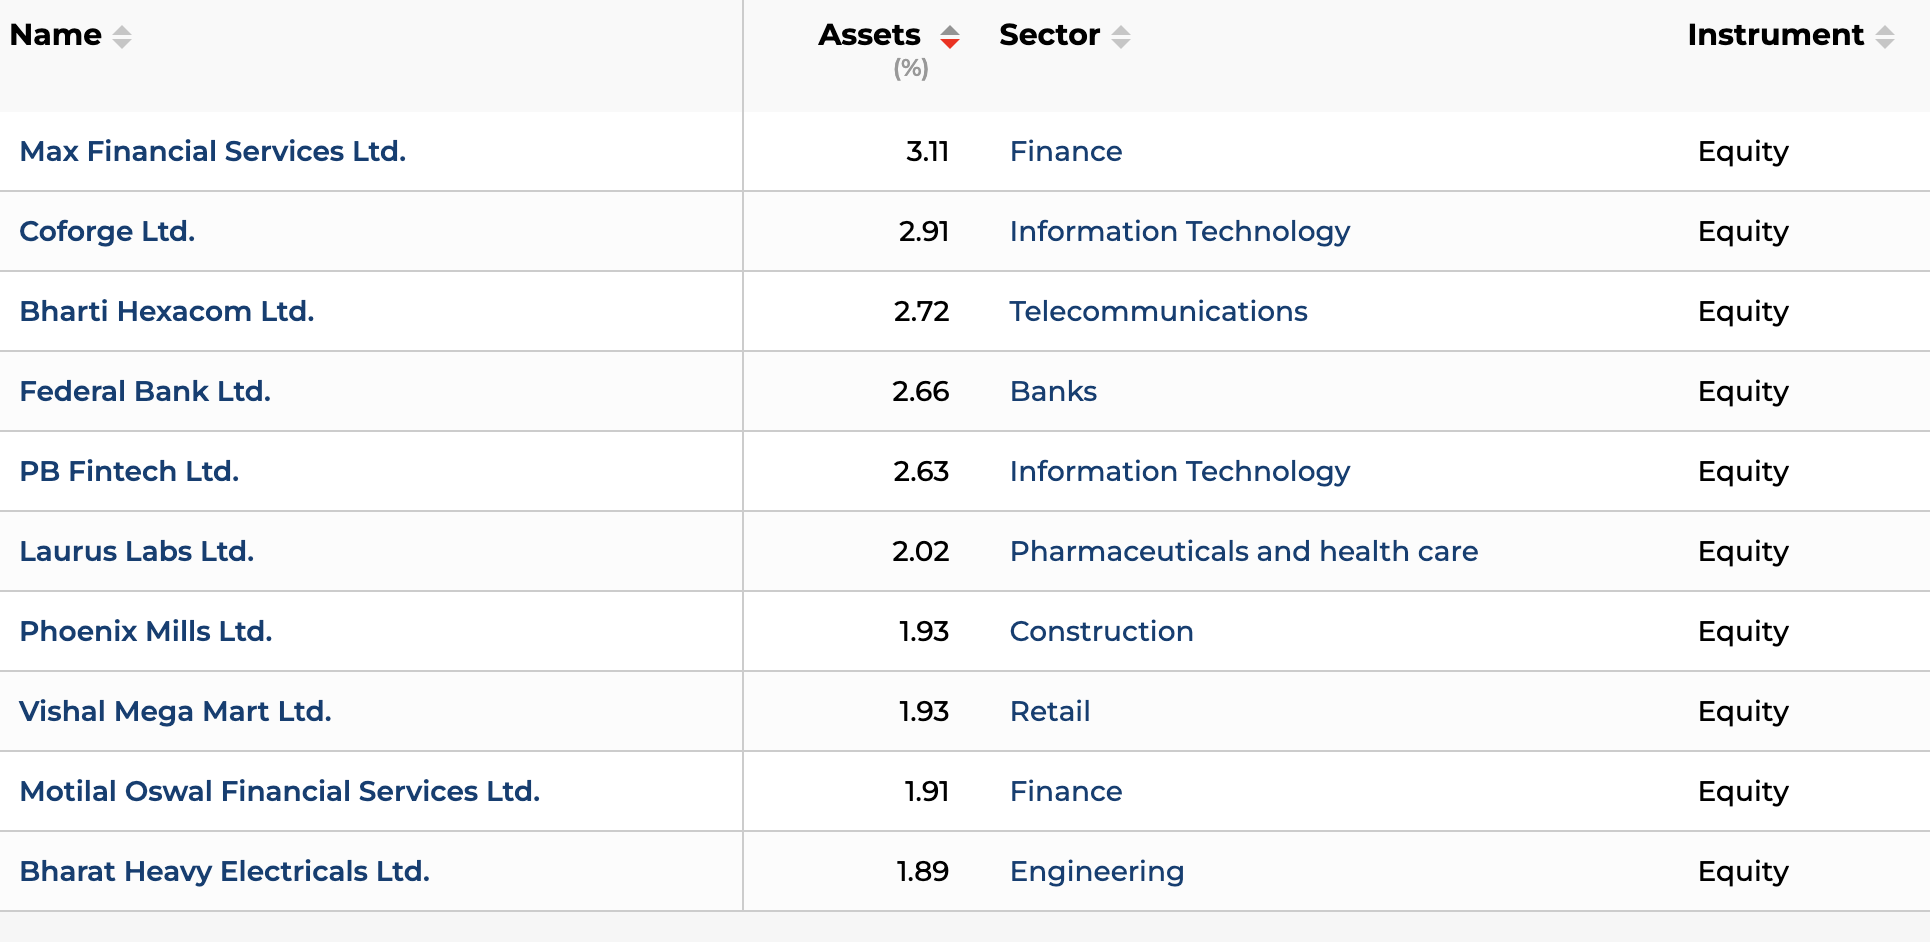
The top 3 sectors are financials (20.9%), healthcare (14.4%), and services (11.9%), comprising 47.2% of the portfolio.
Even when approaching mid-caps, WhiteOak Capital is a bit value-conscious, with portfolio PE and PB ratios of 31.9x and 3.9x, respectively, which is quite unlike many of its mid-cap peers who chase momentum to generate returns.
- WhiteOak Capital ELSS Tax Saver Fund
Launched in October 2022, this fund has an AUM of over Rs 500 crore. Although it’s a smaller fund (not the smallest), it ranks among the top performers in the equity-linked savings schemes, or tax saver funds, category. Over a 3-year period, the fund has clocked a pleasant 15.2% CAGR and, since its launch, a 17.4% CAGR (as of 15 September 2026).
In both these time periods, WhiteOak Capital ELSS Tax Saver Fund has outperformed the BSE 500 TRI by a remarkable margin: by 6.2% over 3 years and by 5.5% since its inception. In other words, it has maximised alpha.
Report Card of WhiteOak Capital ELSS Tax Saver Fund
| Absolute Returns (%) | CAGR (%) | |||
| 6 Mths | 1 Yr | 3 Yrs | Since Inception | |
| WhiteOak Capital ELSS Tax Saver Fund | 13.4 | 1.9 | 15.2 | 17.4 |
| Category Median | 7.3 | -2.0 | 10.1 | — |
| BSE 500 TRI | 5.6 | -2.6 | 9.0 | — |
The returns data is as of 15 September 2026.
Source: Value Research
Moreover, WhiteOak Capital ELSS Tax Saver’s performance seems stellar compared to the category median CAGR of 10.1%. Over a 3-year period, the fund has fared far better than the oldest fund in the category – the SBI ELSS Tax Saver Fund (12.5% CAGR) as well as a similar-sized peer, the Edelweiss ELSS Tax Saver Fund (12.3% CAGR)
What’s impressive is that it delivered these returns while keeping risk well in check. The fund’s standard deviation of 14.9% is well below the category median (SD of 15.1%) and the BSE 500 TRI (SD of 15.2%). On a risk-adjusted basis, it ranks second, with Sharpe and Sortino ratios of 0.81 and 1.08, respectively, well above the category median (0.53 and 0.69 Sharpe and Sortino ratios, respectively) as of 15 September 2026.
WhiteOak Capital ELSS Tax Saver Fund: Risk and Risk-adjusted Returns
| Std Dev (%) | Sharpe Ratio | Sortino Ratio | |
| WhiteOak Capital ELSS Tax Saver Fund | 14.9 | 0.81 | 1.08 |
| Category Median | 15.1 | 0.53 | 0.69 |
| BSE 500 TRI | 15.2 | 0.45 | 0.58 |
All other risk measures have been calculated using calendar month returns for the last three years.
The data is as of 31 August 2026.
Source: Value Research
When broader equity markets saw volatility or profit-booking in early to mid-2026, the fund captured significantly less downside than its category peers. Also, its large-cap orientation and deep diversification have worked in its favour compared with many other ELSS peers, which typically hold 30 to 50 stocks.
The fund currently holds a well-diversified portfolio of over 140 stocks, of which currently 54% are large-caps, 34% small caps, and around 12% mid-caps.
The top 10 stocks comprise 34.5% of the portfolio holdings and include names such as ICICI Bank, HDFC Bank, Bharti Airtel, Nestle India, and Eternal (Zomato), among others.
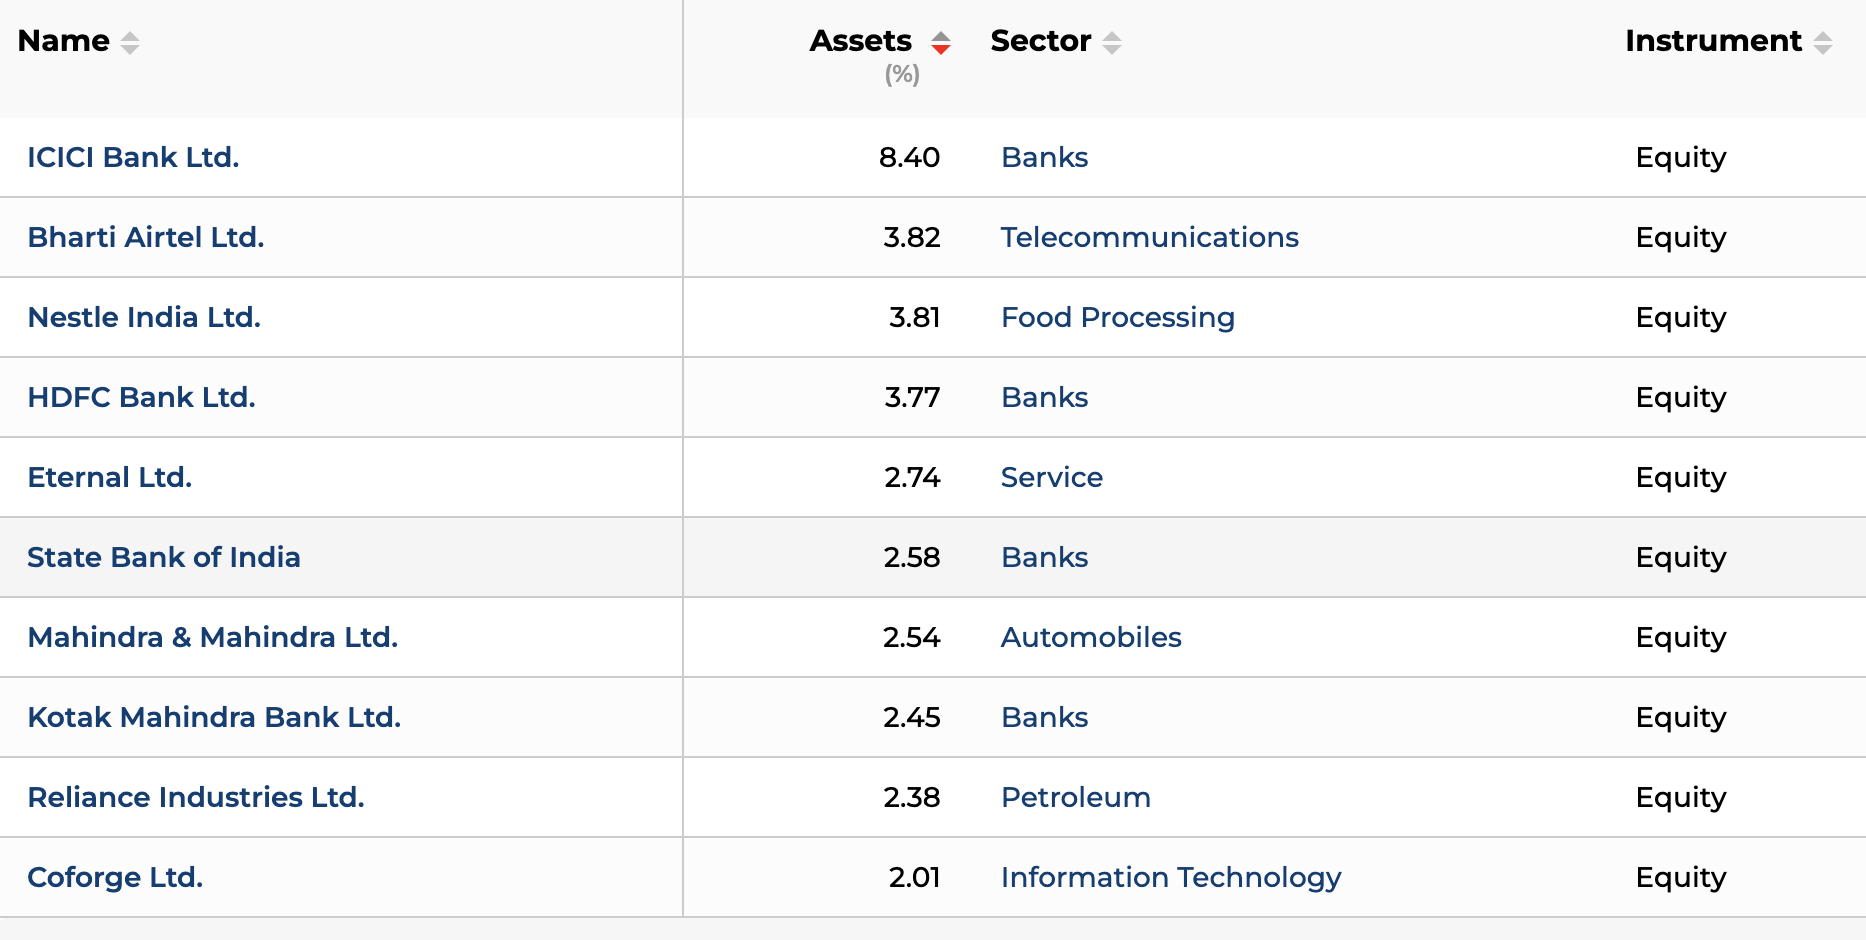
The top 3 sectors are financials (31.2%), services (11.5%) and technology (9.0%), which comprise 51.7% of the portfolio.
The fund managers have taken a blended approach (i.e., a mix of value and growth) but have been value-conscious, as reflected in the PE and PB ratios of 26.1x and 3.7x, respectively.
Will the scheme from Khemka-led White Oak Capital Mutual Fund continue to deliver attractive returns?
White Oak Capital Mutual Fund is a fund house following robust investment processes and systems, plus led by a seasoned team of investment professionals with global experience. Khemka’s opco-finco investment philosophy, which focuses on balanced portfolio construction and alpha generation, is reaping sweet fruits for investors. Khemka’s journey from an engineer to equities has been remarkably successful. As long as the underlying holdings in the respective portfolios continue to fare well, it would be a positive experience for investors.
You may consider adding schemes from WhiteOak Capital Mutual Fund to your 2026 watchlist, in line with your risk appetite and investment objective, provided your investment horizon is at least 5-7 years.
Make sure your allocation to the schemes is in congruence with the asset allocation best suited for you rather than carried away only by the performance. Invest sensibly.
Happy investing!
Note: We have relied on data from www.valueresearchonline.com, www.financialexpress.com, and the factsheets published by the respective fund houses throughout this article. Only in cases where the data was not available, have we used an alternate but widely used and accepted source of information.
Returns data as of 15 September 2026. Direct Plan and Growth Option Considered.
Standard deviation measures the fund’s total volatility. The Sharpe Ratio measures risk-adjusted return and shows how much excess return an investment generates for each unit of risk taken.
Portfolio data as of 31 August 2026. The average price-to-book value ratio and price-to-equity ratio of all underlying stock holdings, weighted by their portfolio weights, are considered.
Disclaimer:
Disclaimer: The above content is for informational purposes only. Mutual Fund investments are subject to market risks. Past returns are not indicative of future returns. Please consult your financial advisor before investing.
Rounaq Neroy has over 20 years of experience in the financial markets and investments. He is a close observer of the Indian economy and writes deeply on the capital markets, mutual funds, stocks, precious metals, asset allocation, wealth management, and investment strategy. His editorials provide interesting, actionable investment ideas to guide readers in the journey of wealth creation and make wise decisions. Rounaq was the Head of Content at PersonalFN (Quantum Information Services Pvt. Ltd.), which also owns Equitymaster.com – India’s oldest and trusted equity research house.