


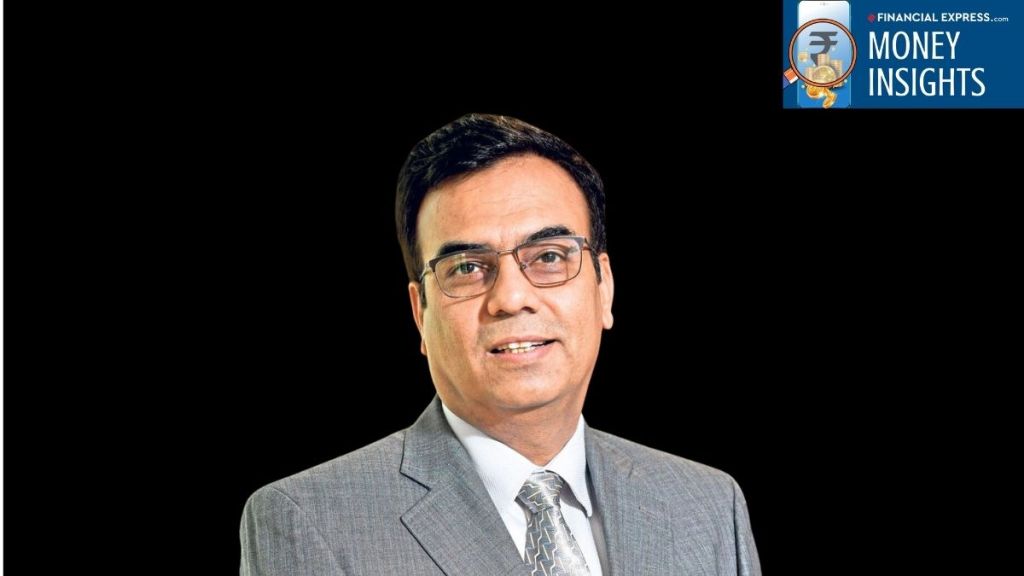

1992, at the height of the Harshad Mehta bull market, a journalist transitioned into core mainstream finance and capital markets by joining GIC Mutual Fund as a trainee.
That one move would trigger a series of events which would lead to the creation of one of India’s most popular mutual fund houses.
The journalist’s name was Sandeep Tandon. And the mutual fund – Quant Mutual Fund.
The foundation of that success is an investment process that one could credit to Tandon’s eclectic journey and experiences. Tandon developed a solid investment process – a fusion of man, machine, and market psychology, setting him apart from the archetypal Indian fund managers. He called this the VLRT framework.
The essential mantra was simple yet powerful – ‘Being Relevant’ and ‘Predictive Analytics.’ And with that, Tandon took the Quant Group forward.
Tandon’s entry into mutual funds started with the acquisition of Escorts Mutual Fund – a small, lagging fund house at the time (at an estimated deal value of Rs 250 crore). He rebranded it as Quant Mutual Fund.
The VLRT Framework: Data Over Discretion
What makes Tandon’s investment approach unique is his objectivity. He looks at data as God and does not shy away from very active, aggressive portfolio churning. He does not see high portfolio turnover as negative — on the contrary, at times in the interest of investors—and thus does not shy away from making large portfolio shifts, moving with changing liquidity conditions and taking positions that can look uncomfortable to conventional investors. His investment philosophy is hinged on being active, absolute, and unconstrained.
Tandon’s focus is on understanding the difference between price and value, tracking money flows across asset classes, recognising what drives market participants, and being highly aware of the cycles that govern how the other three dimensions interact.
The 100% Turnover Strategy: Profiting from Volatility
Tandon’s approach has so far reaped rewards for investors in many of his equity mutual fund schemes, including Quant Small Cap, Quant Mid Cap, and Quant Value, among others. But Tandon, the CIO of Quant Mutual Fund, does not call himself a ‘star fund manager’. It is the investment framework or process and data that are the real stars, he has often stated.
Navigating Volatility and Regulatory Scrutiny
Quant Mutual Fund continues to receive net inflows into its various equity mutual fund schemes, despite the ongoing front-running case in June 2024, with no final penal order issued yet. In other words, investors are exuding confidence in him and his team’s ability to create wealth, backed by an evolved and tested approach to stock picking.
Today, Quant Mutual Fund’s assets are over the Rs 1 lakh crore mark (up from around Rs 235 crore in 2018), and a majority of his fund house’s assets are concentrated in equity sub-categories, with the Quant Small Cap Fund comprising roughly one-third of the AMC’s total assets, valued at over Rs 1.03 lakh crore.
In many ways, Tandon’s unusual character in Indian asset management – a former journalist who became a market practitioner, a fund manager who built a data-driven investment machine and an investor who seems less interested in predicting where the market goes than in recognising where the money is already moving – is what distinguishes him from many other fund managers of the Indian mutual fund industry.
He is one who moved from observing markets to attempting to decode them for the greater good of investors.
Are investors being rewarded?
Here’s how some popular equity schemes with a 3-year track record are performing.
Report Card of Top Equity Schemes of Quant Mutual Fund
| AUM (Rs Cr.) | Absolute | CAGR | ||||
| 6 Mths (%) | 1 Yr (%) | 3 Yr (%) | 5 Yr (%) | 10 Yr (%) | ||
| Quant Value Fund | 1,945 | 16.3 | 21.0 | 21.4 | — | — |
| Category Median | 1.0 | 4.6 | 14.2 | 14.2 | 14.7 | |
| Quant Small Cap Fund | 34,069 | 23.2 | 17.1 | 17.6 | 20.6 | 20.9 |
| Category Median | 19.8 | 16.2 | 16.6 | 18.2 | 17.6 | |
| Quant Flexi Cap Fund | 7,262 | 12.2 | 16.7 | 16.4 | 15.5 | 19.2 |
| Category Median | 5.8 | 6.0 | 13.1 | 11.8 | 13.7 | |
| Quant Large and Mid Cap Fund | 3,496 | 16.0 | 14.2 | 16.1 | 16.6 | 16.2 |
| Category Median | 5.2 | 7.9 | 15.0 | 14.0 | 15.0 | |
| Quant ELSS Tax Saver Fund | 13,382 | 11.8 | 16.3 | 15.7 | 16.3 | 19.8 |
| Category Median | 2.5 | 3.4 | 12.4 | 12.1 | 13.7 | |
| Quant Mid Cap Fund | 8,107 | 13.3 | 8.7 | 12.6 | 16.7 | 18.3 |
| Category Median | 9.3 | 11.3 | 18.1 | 16.6 | 17.1 | |
| Quant Multi Cap Fund | 7,717 | 14.5 | 10.8 | 10.5 | 12.7 | 18.0 |
| Category Median | 9.5 | 10.8 | 15.5 | 14.1 | 15.0 | |
| Indices: | ||||||
| BSE 500 – TRI | 1.1 | 3.3 | 11.7 | 10.8 | 13.3 | |
| BSE 250 SmallCap – TRI | 15.2 | 8.4 | 14.1 | 15.7 | 15.0 | |
| BSE Large Mid Cap – TRI | -0.6 | 2.4 | 11.2 | 10.3 | 12.8 | |
| BSE 150 MidCap – TRI | 7.6 | 9.4 | 16.6 | 16.6 | 17.0 | |
The list here is not exhaustive.
The returns data is as of 1 September 2026.
Source: Value Research
Backed by the investment process or framework that Tandon developed, the table above shows that many equity schemes of Quant Mutual Fund are doing well – most outperforming their peers and their respective benchmark indices.
This is due to a very agile approach to managing the portfolio, with adaptive risk-management exercises powered by analytics and assessments of macroeconomic factors, and without shying away from timing and churning – unlike the buy-and-hold approach some of its peers follow. Rather than waiting for the investment thesis to play out, the Tandon-led Quant Mutual Fund manages portfolios aggressively, at times indulging in momentum plays. Plus, in certain schemes, an unconventional approach is followed.
Beyond PE Ratios: Redefining Value Investing
For example, when managing the Quant Value Fund, it defines value as relative value, focusing on stocks trading at a discount to their future earnings potential, business turnarounds, or corporate restructuring opportunities (mergers, demergers, and acquisitions), rather than some of the traditional value funds that suffer ‘value traps’ by giving weightage largely to price-to-equity (PE), price-to-book value, and price-to-sales as of some key parameters.
The ‘V’ in the VLRT framework has helped Quant Value Fund identify beaten-down and mispriced businesses, and the ‘T’ has helped identify cyclical turnarounds ahead of the broad consensus. At the same time, money flows and market sentiment help to confirm when a value stock is ready to re-rate. This approach and tactical allocations have helped Quant Value Fund to clock a 21.4% compounded annualised return, remarkably higher than the category median (14.2% CAGR) and the BSE 500 – TRI (11.7%) as of 1 September 2026.
The Early-Exit Advantage: Locking in Small-Cap Outperformance
Similarly, the Quant Small Cap Fund has clocked CAGRs of 17.6% and 20.6% over 3-year and 5-year periods, respectively, outperforming its category median (16.6%) and the BSE 250 SmallCap – TRI (14.1%) over these periods as of 1 September 2026. This is mainly because, as small-cap stocks undergo a sharp re-rating, the fund house exits or trims them early to lock in gains rather than waiting through long valuation fatigue or earnings pullbacks. In other words, it identifies wealth-creation opportunities early on and then books the gains.
The 200% Turnover Engine: Front-Running Sector Turnarounds
For instance, the fund took heavy, non-consensus allocations in infrastructure, PSU, capital goods, power, metals, and chemicals turnarounds long before these themes dominated the broader market index. For these reasons, the portfolio turnover ratio has ranged from 100% to 200%. Currently, it holds a diversified portfolio of 100 stocks, with the top 10 accounting for 35.9%, which include names such as HFCL, RBL Bank, and Adani Enterprises, among others.
Quant Flexi Cap: The Mid-Cap Bet That Paid Off
Likewise, the Quant Flexi Cap Fund has fared well. Over 3 years and 5 years, the fund has clocked 16.4% and 15.5% CAGRs, respectively, noticeably higher than the category median and the BSE 500 -TRI (as of 1 September 2026). The past overweight allocation to small-caps and mid-caps, particularly in early 2021, has reaped rich rewards.
Pivoting to Safety: Why 67% of Flexi Cap is Now Large-Cap
For example, Adani Power (which has since become a mega-cap), Tata Power, BHEL, and Aurobindo Pharma, among others, have multiplied manifold over the last five years. However, given the risks in smaller companies and volatile market conditions, Quant Flexi Cap currently holds a dominant portion (around 67%) of its assets in large-caps. All the top 10 holdings of the fund, which comprise 60.2% of the total portfolio, are large-caps and include names such as Samvardhana Motherson International, Adani Enterprises, Adani Power, Tata Power and Aurobindo Pharma amongst others.
Risk Taken by Quant Mutual Fund Schemes
| Risk Ratios | |||
| Std Dev (%) | Sharpe Ratio | Sortino Ratio | |
| Quant Value Fund | 21.5 | 0.78 | 1.53 |
| Category Median | 15.1 | 0.62 | 0.82 |
| Quant Small Cap Fund | 20.2 | 0.65 | 1.10 |
| Category Median | 19.6 | 0.65 | 0.91 |
| Quant Flexi Cap Fund | 19.3 | 0.62 | 1.05 |
| Category Median | 15.2 | 0.55 | 0.69 |
| Quant Large and Mid Cap Fund | 19.5 | 0.60 | 0.93 |
| Category Median | 15.8 | 0.63 | 0.81 |
| Quant ELSS Tax Saver Fund | 18.2 | 0.62 | 1.03 |
| Category Median | 15.1 | 0.53 | 0.69 |
| Quant Mid Cap Fund | 18.1 | 0.48 | 0.71 |
| Category Median | 17.8 | 0.75 | 0.96 |
| Quant Multi Cap Fund | 18.1 | 0.36 | 0.58 |
| Category Median | 16.0 | 0.68 | 0.86 |
| Indices: | |||
| BSE 500 – TRI | 15.2 | 0.45 | 0.58 |
| BSE 250 SmallCap – TRI | 21.7 | 0.46 | 0.72 |
| BSE Large Mid Cap – TRI | 14.8 | 0.44 | 0.54 |
| BSE 150 MidCap – TRI | 17.8 | 0.66 | 0.86 |
The list here is not exhaustive.
The Risk Measures have been calculated using calendar month returns for the last three years and are as of 31 August 2026.
Source: Value Research
Balancing Risk and Reward in a High-Churn Model
What’s important, however, is that Tandon’s investment framework exposes investors to high risk (as indicated by the standard deviation) across many equity mutual fund schemes, relative to the category median and the respective benchmark indices. For instance, the risk of Quant Value Fund (SD of 21.5%) is remarkably higher than the category median and the BSE 500 – TRI. But when evaluated on a risk-adjusted basis, it seems justified with higher Sharpe and/or Sortino ratios.
In other words, while the risk is high, many equity mutual fund schemes are adequately compensating investors.
Can the appealing performance be sustained?
Whether the appealing returns of Quant Mutual Fund’s equity schemes can be sustained in the future depends on how Tandon’s dynamic investment framework navigates structural market shifts and, ultimately, on how the underlying holdings of the respective equity mutual fund schemes perform.
Tandon does not hold the magic wand to generate returns, but he surely has a process or framework that could define the rewards for the investors.
What should you, the investor, do?
If you are already an investor in equity schemes in Tandon’s Quant Mutual Fund, make sure they are congruent with your risk profile, investment objective, financial goal/s and the asset allocation best suited for you. This applies even if you are considering making fresh investments and are a new investor. Also, take care to diversify your portfolio across fund houses, not just a couple of them.
Invest sensibly; be a thoughtful investor.
Happy investing!
Note: We have relied on data from www.valueresearchonline.com, www.financialexpress.com, and the factsheets published by the respective fund houses throughout this article. Only in cases where the data was not available, have we used an alternate but widely used and accepted source of information.
Returns data as of 1 September 2026. Direct Plan and Growth Option Considered.
Standard Deviation is a measure of the total volatility of the fund. The Sharpe Ratio is a measure of risk-adjusted return that shows how much excess return an investment generates for each unit of risk taken.
Portfolio data as of 31 July 2026. The average price-to-book value ratio and price-to-equity ratio of all underlying stock holdings, weighted by their portfolio weights, are considered.
Disclaimer:
Disclaimer: The above content is for informational purposes only. Mutual Fund investments are subject to market risks. Past returns are not indicative of future returns. Please consult your financial advisor before investing.
Rounaq Neroy has over 20 years of experience in the financial markets and investments. He is a close observer of the Indian economy and writes deeply on the capital markets, mutual funds, stocks, precious metals, asset allocation, wealth management, and investment strategy. His editorials provide interesting, actionable investment ideas to guide readers in the journey of wealth creation and make wise decisions. Rounaq was the Head of Content at PersonalFN (Quantum Information Services Pvt. Ltd.), which also owns Equitymaster.com – India’s oldest and trusted equity research house.