




The India investing story is a simple story of consistent long-term real and nominal GDP growth, which over long cycles has generally converted into nominal revenues and eventually into profitability by firms, and which has been reflected and rewarded by long-term returns in the stock market.
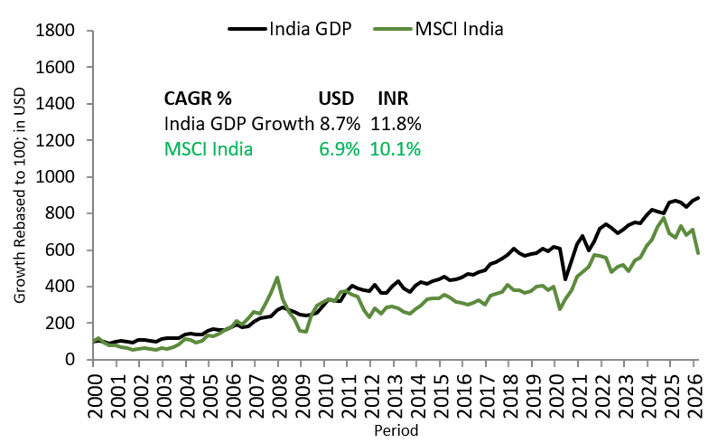
This is why we also term it ‘Predictable India’ – a close link between long-term GDP growth and stock market returns. (See Chart 1 below and read the linked article above for more details)
Chart 1: The ‘Predictable’ Link between GDP growth and stock market returns
Indian GDP growth, company profitability and corporate return ratios over long cycles have tended to be higher than other markets/indices, and hence India also tends to trade at a valuation premium over other world markets.
Chart 2 and 3: India commands a valuation premium due to higher growth potential
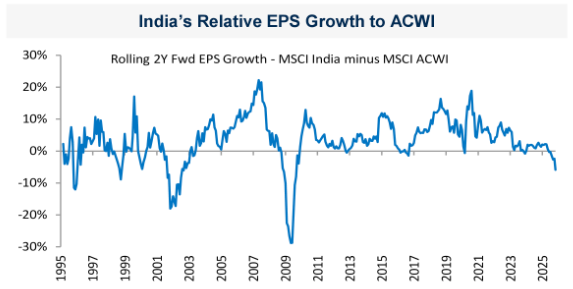
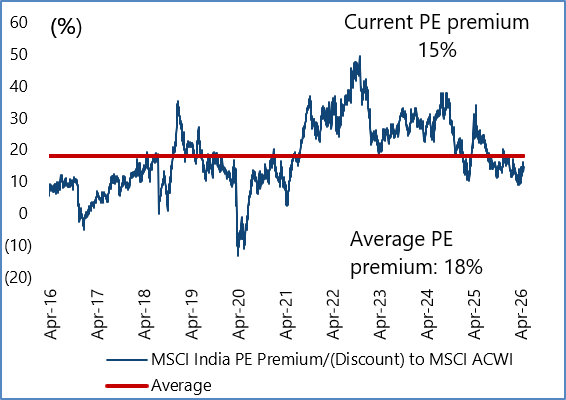
ACWI – All Country World Index; EPS – Earnings Per Share; PE – Price to Earnings
However, as visible in the charts, India’s recent market performance has been underwhelming. Indian markets absolute and relative earnings growth has been lower/weaker than historical averages and thus has seen a price and valuation correction.
Table 1: India’s record underperformance – Has it reversed?
| (Gross Absolute Total Returns in USD) | 1 Month | YTD | Sept 2024 to July 2026 (Annualised returns in bracket) |
| MSCI India Index | 1.8% | -8.1% | -12.5% / (-7.0%) |
| MSCI Korea Index | -17.1% | 81.5% | 185.9%/ (77.4%) |
| MSCI Taiwan Index | -5.3% | 54.0% | 126.1% / (56.1%) |
| MSCI Emerging Markets Index | -3.0% | 20.3% | 58.9%/ (28.8%) |
This was not unexpected. My 2026 outlook was titled Simple Story, Getting Complicated – where I reviewed 2025 with how growth impulses were slowing; valuations had remained stretched and market returns were to be modest. The extent of foreign investor selling and the dramatic underperformance though has also meant that India’s weightage in global indices has fallen sharply.
Chart 4: Are Foreign Investors ‘anti- India’?
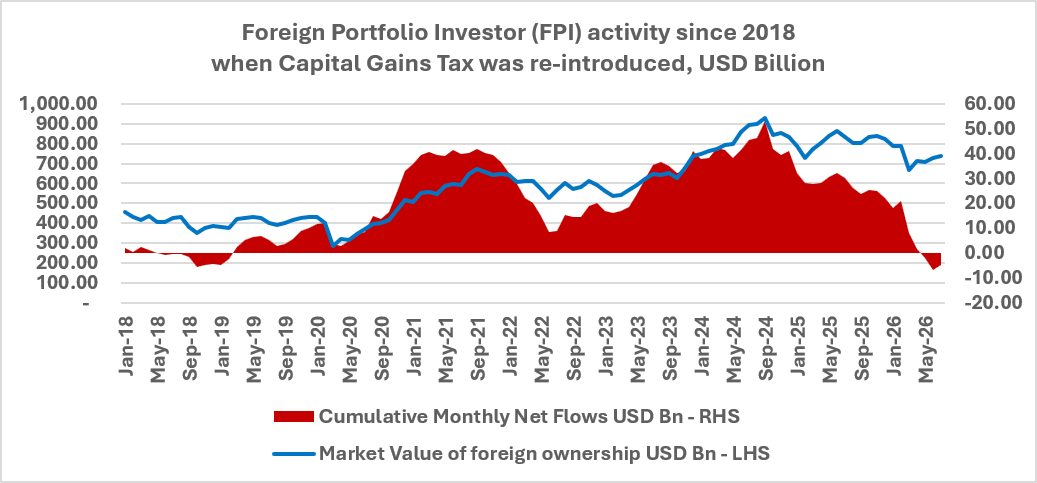
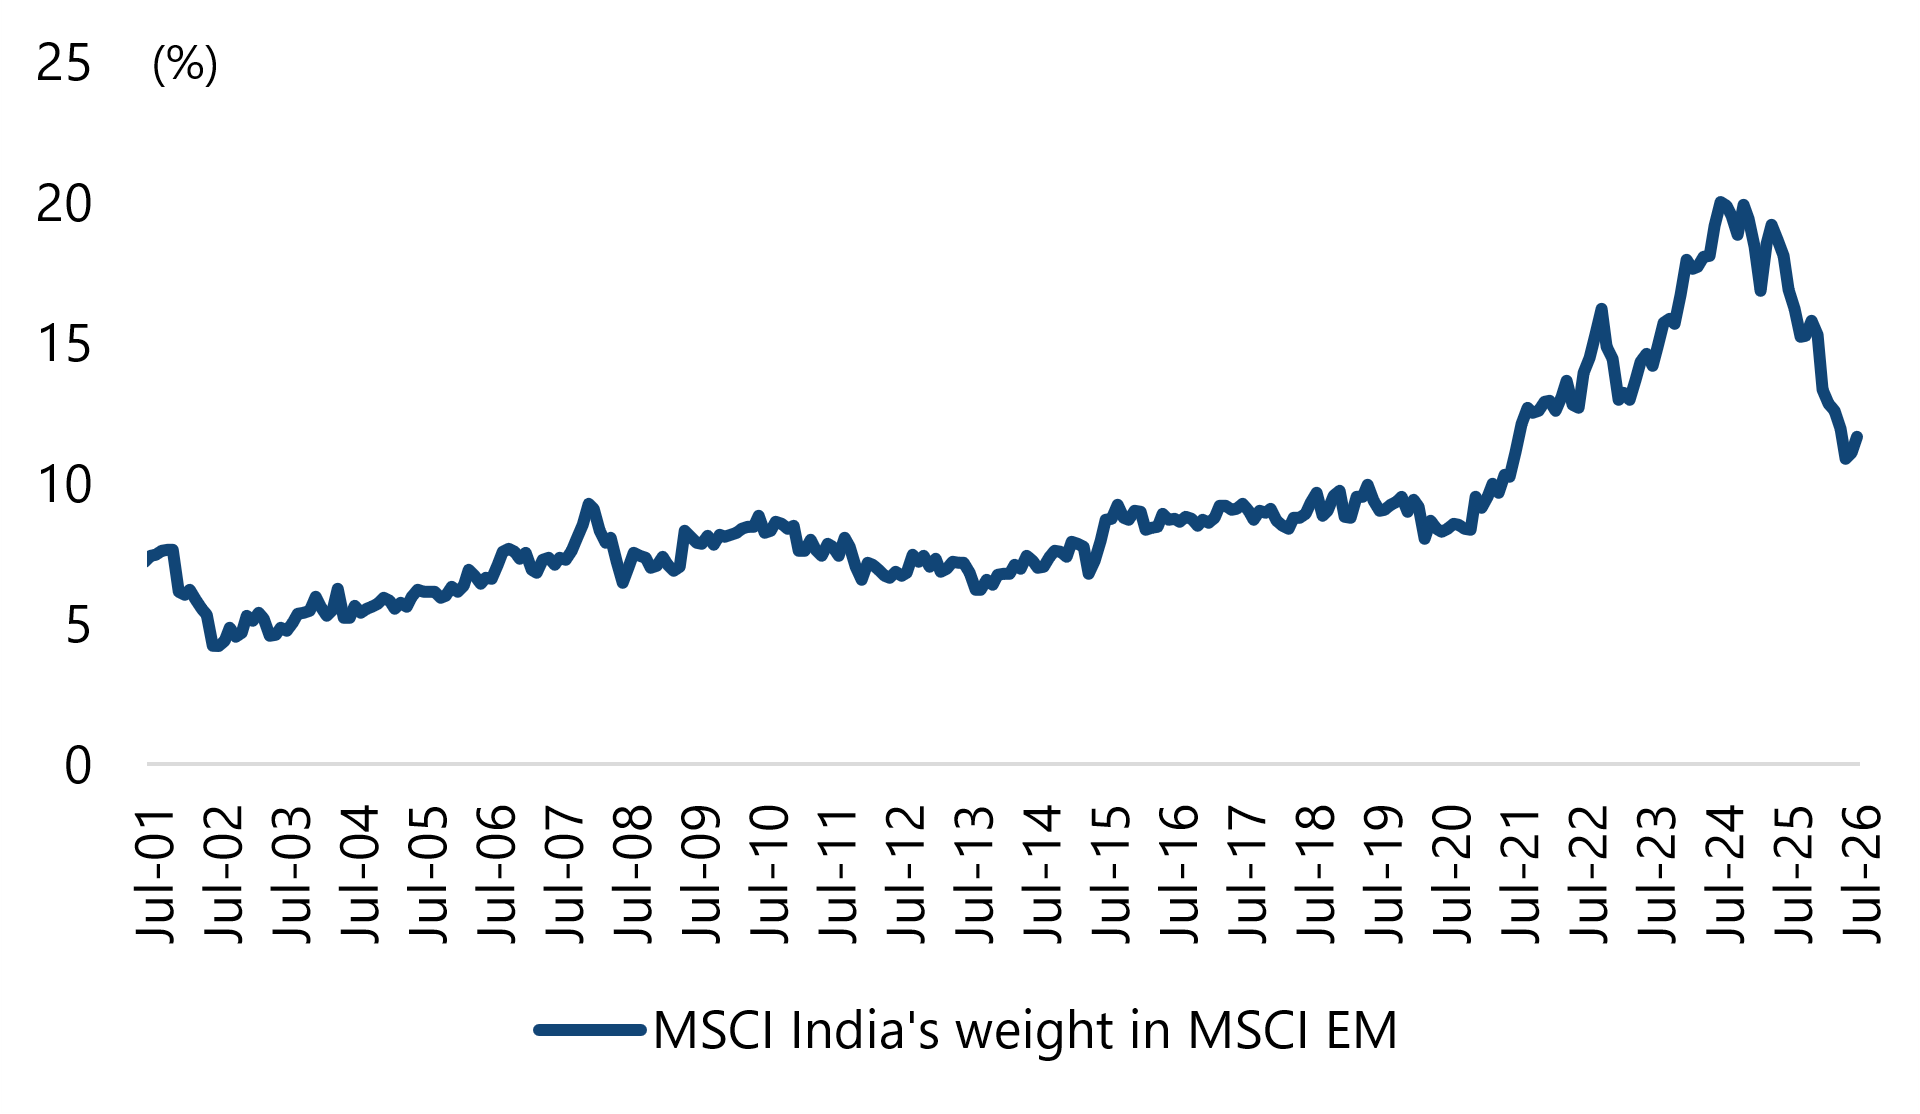
Chart 5: India’s has seen a dramatic fall in allocation in global/emerging market portfolio
There is no assurance or indication that the above portfolio composition of the index will be sustained in future and the same may vary as per the market conditions, from time to time.
As seen in the charts above, Foreign investors have sold over USD 50 billion since September 2024. India’s weight in the MSCI emerging markets index is now down by almost half to ~11% from the peak of ~20%. Global emerging market managers also seem to be running an India under-weight in their portfolios.
As I wrote here: India Investing: ‘TINA’ to ‘ANTI’, India investment sentiment has changed dramatically, especially post the advent of the AI investing thematic. With India markets lacking exposure to AI thematic in terms of clear plays on – AI foundational labs, memory companies, semi-conductor chip manufacturers, data centers etc., India has seen outflows from global investors and at the same time it has underperformed the likes of Taiwan, Korea, and broad emerging markets.ii (see Table 1)
As the AI thematic seems to be facing a few hiccups, we have seen India’s relative performance improve over the past 2 months. If India underperformed for being ‘Not AI’; should India outperform when the world turns ‘Anti AI’?
The overall exposure to this AI thematic in an investment portfolio is likely to be reasonably high. Apart from technology and AI related stocks in public markets, global institutional investors are also likely to have increased exposure through their private equity investments, holdings bonds issued by hyper scalers, and via investments in data center’s and the ecosystem in their infrastructure and real estate allocations. These assets could also show increased correlations. I believe there is substantial risk sitting in global portfolios exposed to this AI thematic. This risk will need to be diversified.3
Chart 6: AI concentration risk in global equity allocations is rising.
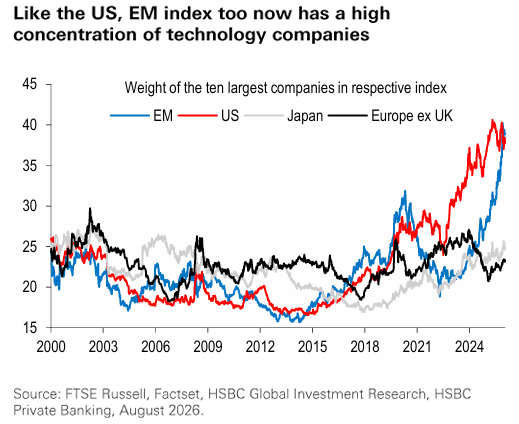
Table 2: India is diversified
| Sector | MSCI AC World 31 July 2026 | MSCI India 31 July 2026 |
| Information Technology | 30% | 7% |
| Financials | 17% | 31% |
| Industrials | 11% | 11% |
| Consumer Discretionary | 9% | 13% |
| Healthcare | 8% | 6% |
| Communication Services | 8% | 5% |
| Consumer Staples | 5% | 5% |
| Materials | 4% | 9% |
| Energy | 4% | 8% |
| Utilities | 2% | 4% |
| Real Estate | 2% | 1% |
The Chart represents the weight of the Top 10 stocks in the respective FTSE Russell index used. The report states that the increase in concentration in these indices is driven by technology companies.
There is no assurance or indication that the above composition of the index will be sustained in future and the same may vary as per the market conditions, from time to time.
India as Risk Diversifier
This is unusual given the usual logic of allocating to India on the growth story in the economy and its reflection in stock market returns. (see chart 1)
However, given the trend of the thematic AI allocation which has no doubt done well and the fact that India does not have any relevant play and has thus underperformed, has led to a large reduction in India’s allocation in global portfolios. I have argued about India’s overall under-allocation in the past on the Great India Under-allocation. The recent trend has exacerbated India’s under allocation.
The global AI thematic exposure from a risk perspective seems to be a lot higher given the exposure across asset classes and the expected cross correlation3. In our view, given the global exposure and risks associated to the AI trade, investment portfolios may need some diversification to those risks. As we shown above, Indian markets have not participated to that extent in this global AI thematic trade and has thus underperformed. An increased allocation to India at this juncture could thus be considered as a hedge against the global AI trade.
Chart 7: India Investing across Global Mood Swings
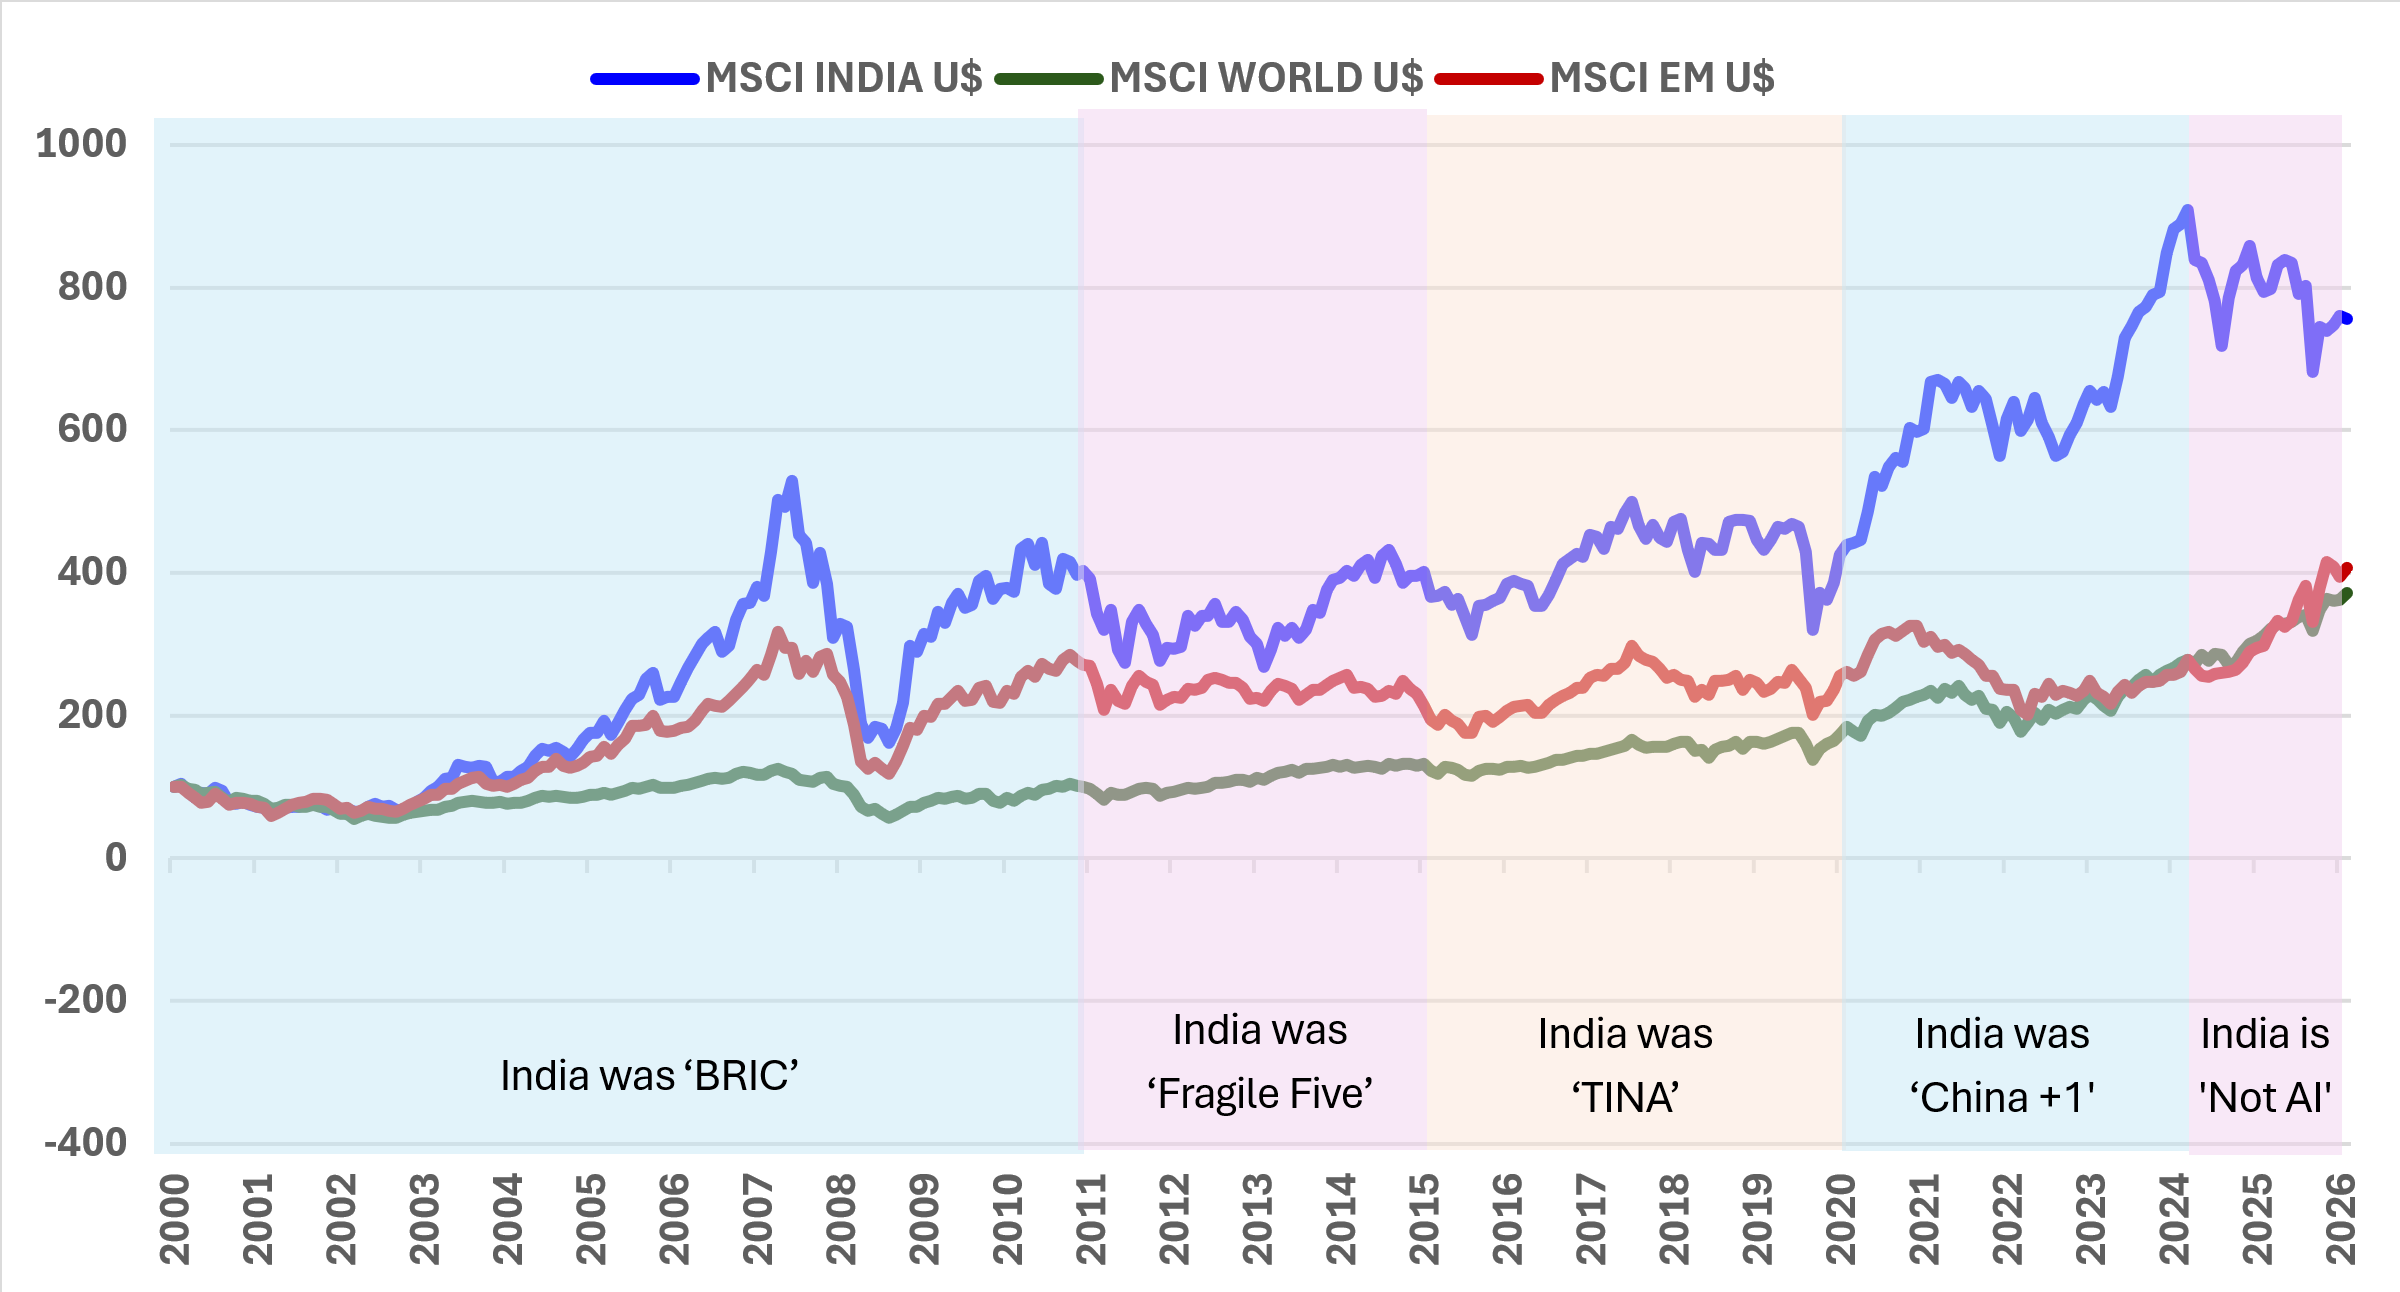
‘BRIC’ = Brazil, Russia, India, China as labelled by Goldman Sachs. ‘Fragile Five’ = Countries with high current account deficits labelled by Morgan Stanley. ‘TINA’ = There is no alternative. ‘China +1’ = Countries supposed to benefit from investments moving out of China. ‘Not AI’ = Lacking artificial intelligence linked investing themes.
Past performance may or may not sustain in the future. Returns may increase or decrease as result of currency fluctuations. Please refer to the Disclosure Statement at the end of this document.
Arvind Chari is a Chief Investment Strategist and has been with Quantum Advisors India group since 2004. Arvind has over 20 years of experience in long-term India investing across asset classes. Arvind is a thought leader and guides global investors on their India allocation.
Disclaimer:
This article is for educational and discussion purposes only and is not intended as an offer or solicitation for the purchase or sale of any investment in any jurisdiction. No advice is being offered nor recommendation given and any examples are purely for illustrative purposes. The views expressed contain information that has been derived from publicly available sources that have not been independently verified. No representation or warranty is made as to the accuracy, completeness, or reliability of the information.
The views and opinions expressed in this article are my personal views and should not be construed of the Firm. There is no assurance or guarantee that the historical result is indicative of future results, and the future looking statements are inherently uncertain and cannot assure that the results or developments anticipated will be realized.
i Jefferies Research – India Strategy
ii India is NOT AI – HSBC Global Research