



Ask most people what Thomas Cook does and they will tell you it sells holidays. The name has been on Indian high streets since 1881, which is a long time to build an association in the public mind.
That association is not entirely correct.
In FY26, Thomas Cook (India) Limited earned ₹428 crore of operating profit. The company operates in four business segments and the largest single share came from selling package holidays and running tours. No argument there.
But that’s not the most profitable segment. The company’s foreign exchange business turned ₹326 crore of revenue into ₹149 crore of EBIT (Earnings before Interest & taxes). That’s a 46% operating margin, against a blended margin of 5% for the consolidated business.
In fact, the Travel segment accounted for 51.8% of the total EBITDA the company earned in FY26, highlighting the significance of the company’s non-travel business.
Segment performance, FY24–FY26
| ₹ crore | FY24 | FY25 | FY26 |
| Financial Services (forex) | |||
| Revenue | 302 | 328 | 326 |
| EBIT | 124 | 150 | 149 |
| EBIT margin | 40.9% | 45.7% | 45.8% |
| Travel & Related Services | |||
| Revenue | 5,619 | 6,469 | 6,703 |
| EBIT | 193 | 249 | 222 |
| EBIT margin | 3.4% | 3.8% | 3.3% |
| Leisure Hospitality (Sterling) | |||
| Revenue | 456 | 501 | 534 |
| EBIT | 137 | 129 | 129 |
| EBIT margin | 30.0% | 25.8% | 24.2% |
| Digital Imaging (DEI) | |||
| Revenue | 923 | 842 | 836 |
| EBIT | 54 | 27 | 11 |
| EBIT margin | 5.9% | 3.2% | 1.3% |
A keen observer would also notice the heterogenous nature of these businesses even if they’re intricately linked. For example, hotels have completely different capital needs and margin profile versus a Digital Imaging (DEI) and forex business.
The consequence of clumping them all together is that a 3% margin business is consolidated with a 35% and 46% margin business. It’s not surprising that investors are reluctant to value each one on their own merit. Which is why on 20 March 2026, the board decided that these four segments should be split into two businesses and listed separately.
Demerger overview
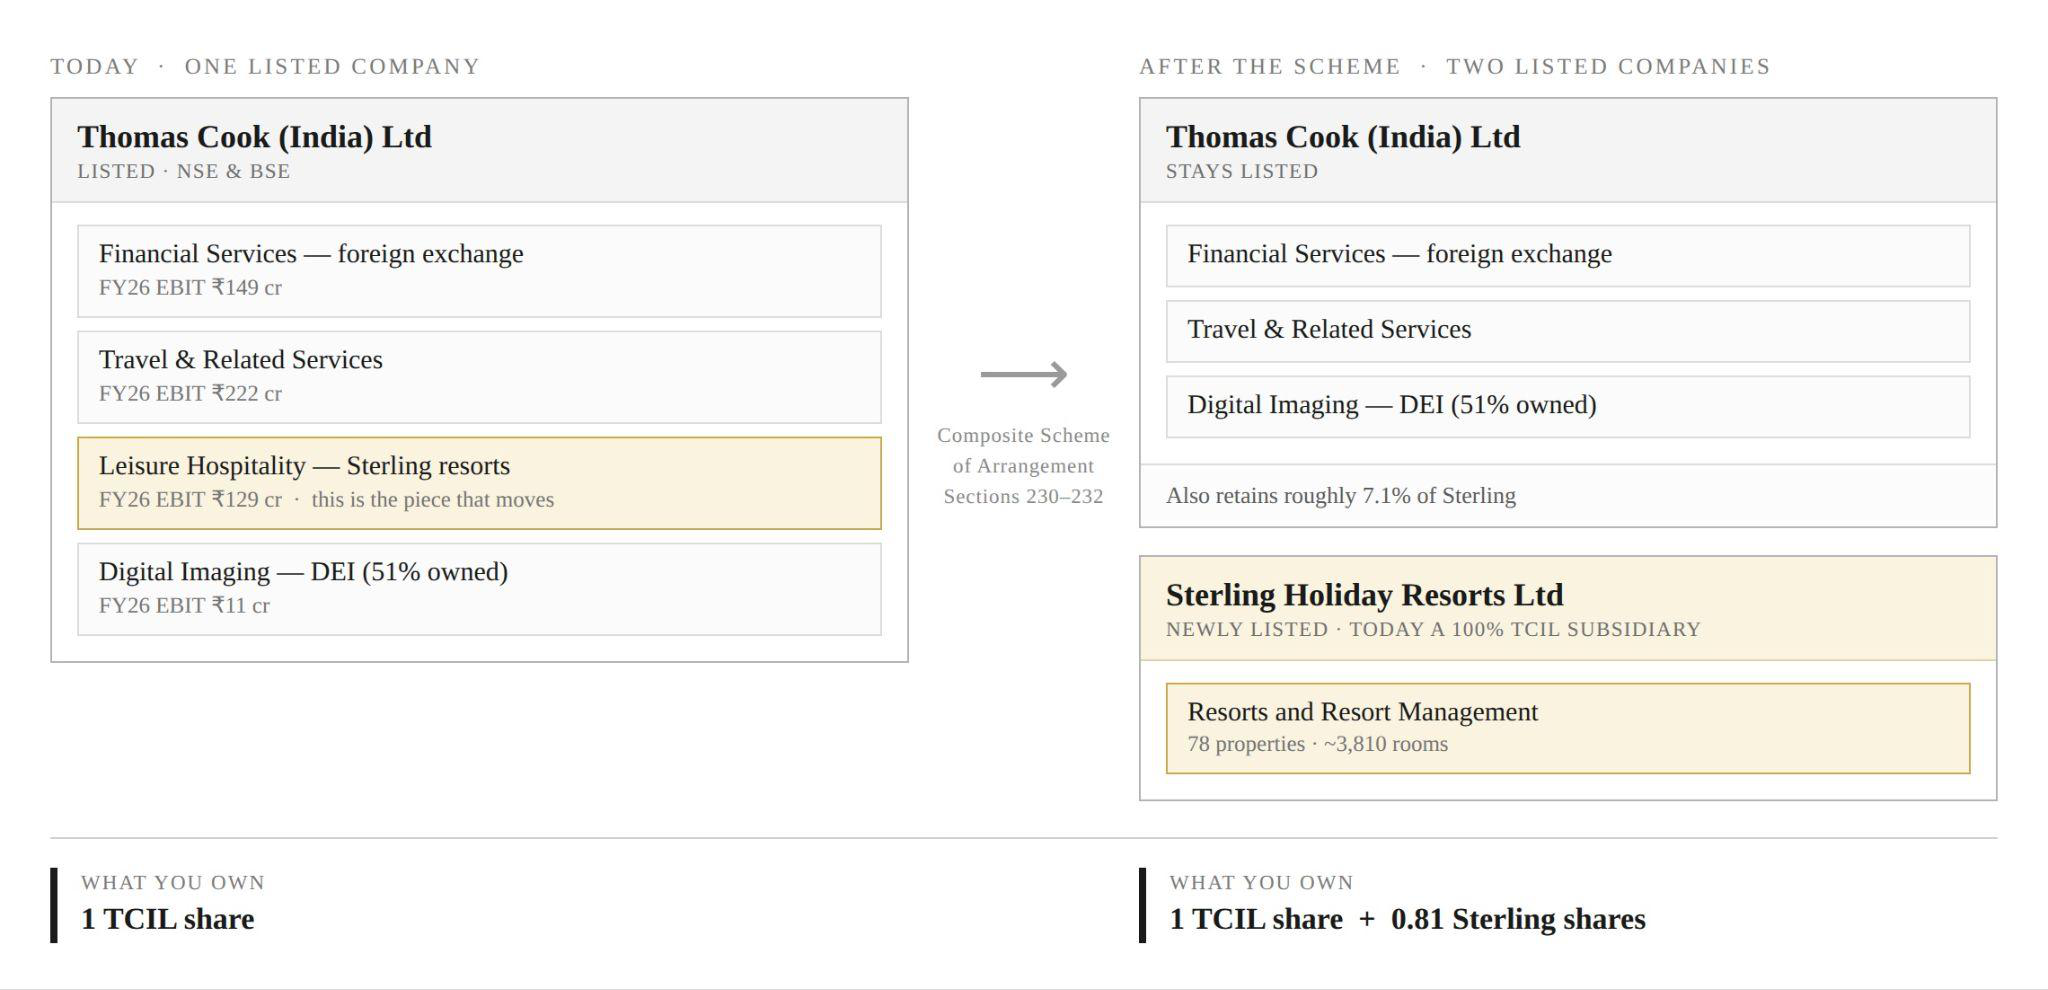
As Sterling Holiday Resorts is listed separately, for the first time perhaps in twelve years, it is likely to be priced by investors who understand hotels, on metrics that matter for hotels.
Let’s dive into the details.
Why Demergers Create Value
If you’re reading the Special Situation Alert series for the first time, this explainer on how & why demergers work might be useful. For those who are familiar, you may skip to the next section.
The underlying idea behind a demerger/spin-off special situation is that when one listed company houses two very different businesses, the market rarely values it well. The investors who want the high-margin franchise do not want the low-margin one attached, and the analysts who cover one have no framework for the other. So the whole trades at a blended, compromise multiple that flatters the weaker half and penalises the better one, exactly as in the case of Thomas Cook (India) Ltd. That is the conglomerate discount.
A demerger is meant to unlock value and plug the conglomerate discount. Post demerger, each business starts trading on its own, attracts its own investors and analysts, gets its own management focus and its own capital allocation, and is freed from the other’s cycle.
In the process, the hope is that the discount will evaporate. It works best when the two halves are genuinely different in growth, margins, capital intensity and investor base and either there is a massive undervaluation to begin with or the demerged entities continue growing the business post the spin-off and listing.
India’s history is a long list of the patterns paying off. Bajaj Auto’s 2008 split into Bajaj Auto and Bajaj Finserv created two giants worth many times the original whole. Triveni Engineering carved out Triveni Turbine in 2011, and the spun-off child is now worth more than double its parent. Greenply demerged Greenpanel in 2019 and the MDF business ran up more than 5x in two years.
Some recent examples that haven’t worked out include: Reliance’s Jio Financial in 2023, Piramal Pharma in 2022, and ITC’s hotels demerger in early 2025.
Why This Demerger Makes Sense
Three reasons to spin-off the resorts vertical
1. Hospitality is capital-hungry. Travel services are relatively asset-light. Sterling needs land, buildings and rooms and has a pipeline of 35-plus properties. Forex and travel need working capital, technology and distribution. As one company, with a common balance sheet, all these segments compete for the same capital.
2. Sterling has outgrown. With ₹534 crore of revenue, ₹175 crore of EBITDA at a 33% margin, twenty-five consecutive profitable quarters and a twenty-sixth in Q1 FY27, Sterling has a promising outlook. It is also Debt-free with ₹340 crore of cash. This is no longer a division, it is a company that happens to sit inside another company.
3. Two businesses, two investor bases. Hotel investors price on EV (Enterprise Value) per room, RevPAR (Revenue per Available Room) and occupancy. Travel-services investors price on take rates and forex business on float. Investors who wish to hold only one of these segments, simply cannot right now.
The Spin-off candidate: Sterling Holiday Resorts Limited (SHRL)
Sterling came into the group in September 2014, funded largely by ₹500 crore Fairfax infused through Fairbridge Capital (Mauritius). It was a vacation-ownership company then; twelve years later it is a resort operator with a national footprint.
Sterling Resorts & Hotels – Summary
| Sterling, FY26 | |
| Revenue | ₹534 cr |
| EBITDA | ₹175 cr (33% margin) |
| EBIT | ₹129 cr (24% margin) |
| Resorts | 78, including 6 Nature Trails |
| Rooms | 3,810 |
| Destinations | 65 |
| Occupancy | 59% |
| ARR | ₹6,176 |
| Balance sheet | Debt-free with cash ₹340 cr at 31 Mar 2026 (₹374 cr at 30 Jun 2026) |
| Track record | 25 consecutive profitable quarters at FY26 close; 26th in Q1 FY27 |
It is a leisure portfolio weighted to tier-2 and tier-3 India, so its relevant peer set would include Mahindra Holidays instead of Indian Hotels. Plus, it is debt-free and cash-generative, which is a clean position for a demerged hospitality company to start with.
Sterling Resorts and Hotels Ltd – Business overview
Despite revenue growth over the last 3 years, Sterling EBIT has remained stagnant.
Sterling Resorts & Hotels – Historical summarised Financials
| Sterling (₹ crore) | FY24 | FY25 | FY26 |
| Revenue | 456 | 501 | 534 |
| EBIT | 137 | 129 | 129 |
| EBIT margin | 30.0% | 25.8% | 24.2% |
Today, it has nearly 1,400 more rooms than it had three years ago. During this period, while Revenue went from ₹456 crore to ₹534 crore, its EBIT has not remained flat while EBIT margins have declined.
There are three major reasons for this.
- The company deliberately shut down its old membership-selling business, and FY26 was the first full year without that revenue.
- A new resort takes three to four months to fill, so you carry the cost before you earn anything.
- Most of the new rooms are leased rather than owned, which means depreciation starts from day one and lands squarely on EBIT.
None of that is alarming on its own. But it does mean the expansion so far has bought scale, not profit yet. So, what’s the outlook for this business?
Vikram Lalvani, who runs Sterling, has given the same number on three consecutive calls: an EBITDA margin of 32–35% is what he calls a stable, sustainable range.
Of the 78 properties, 57% are managed and 43% owned or leased. On rooms it’s the other way round, 44% managed against 56% owned or leased, because managed properties tend to be smaller.
‘Managed’ here means Sterling runs someone else’s resort for a fee. It means no capital, no lease, smaller revenue but almost pure margin. ‘Owned and leased’ means Sterling carries the capital cost but also keeps the upside. Roughly two-thirds of the economics still sits on Sterling’s own P&L (profit & loss statement), so this is not an asset-light story pretending otherwise.
Occupancy was 59% in FY26, and the stated target is 65–70% through a full year. So on management’s own numbers there are roughly ten points of occupancy still to recover, and in a hotel that flows almost straight to operating profit.
SHRL growth trend
Q1 FY27 was the best quarter in Sterling’s history, and it came from higher ARR (Average Room Rentals) and occupancy rather than new rooms. Occupancy jumped 700 basis points to 77%. Average room rate rose 10% to an all-time high of ₹7,809. Together those lifted RevPAR 20%.
Revenue rose 21% to ₹170 crore, EBITDA 21% to over ₹62 crore at a 37% margin, and profit before tax 30%. Profit grew faster than revenue, which is what operating leverage looks like when it finally arrives. With twenty-six consecutive profitable quarters, debt-free status, and ₹374 crore of cash, SHRL is in a sweet spot.
Growth outlook
According to the management, the outlook looks positive. Sterling can grow without adding a single room i.e – by filling the ones it has and charging more. In Q4FY26 conference call with investors, Krishna Kumar, the CFO said that rising occupancy and ARR “on a constant 3,810 rooms will definitely help us get the revenues up in the current financial year.” There are also 14 recently opened resorts that have yet to complete a full year, so a chunk of growth is likely to show up over the next two to four quarters.
Then there is expansion. The annual report targets 95 resorts, 75 locations and 4,800 rooms in FY27, from 78, 65 and about 3,800 today respectively, with a pipeline of 35-plus properties and 2,000-plus rooms.
TCIL and the continuing business – Travel, forex, DEI
The demerger removes only Sterling resorts. So the residual Thomas Cook is three businesses:
TCIL – Continuing business summarised Key financial metrics
| FY26 | Revenue (₹ cr) | EBIT (₹ cr) | EBIT margin |
| Financial Services (forex) | 326 | 149 | 45.8% |
| Travel & Related Services | 6,703 | 222 | 3.3% |
| Digital Imaging (DEI) | 836 | 11 | 1.3% |
Before we dig deeper into each of these segments, some basic concepts need to be clarified.
Gross-versus-net Revenue
Imagine you sell a European holiday for ₹1,00,000. Pay the airline ₹40,000 and the hotel ₹45,000. Keep ₹15,000. If you took the risk i.e – you were responsible for taking the loss if nobody shows up, you book revenue on a gross basis: Revenue ₹1,00,000, cost ₹85,000.
If you merely arranged it, you book Net Revenue: ₹15,000. Identical economics but revenue differs by 6-7x.
The annual report clearly mentions that forex income is “reported on a net basis” at ₹326 crore, on ₹13,300 crore of gross turnover (GTV), a take rate of about 2.5%. Corporate Travel is also net: ₹154 crore on ₹2,700 crore of GTV. But destination management, MICE and leisure holidays are booked on a gross basis.
So the ₹6,703 crore travel revenue line is internally mixed up between gross & net revenue. Therefore, the rule for this company is to look at EBIT in rupees and at volumes instead of revenue.
The forex business, and the money it holds for free
Thomas Cook is India’s largest non-bank forex provider, with about a third of the prepaid forex card market and the only non-bank licence across Mastercard, Visa and RuPay.
It earns two ways.
The spread, on ₹13,300 crore of gross turnover (up 8% in FY26), of which retail is ₹9,400 crore and about 80% of forex revenue.
And the float. Customers load cards before they travel, and that money sits with Thomas Cook until spent. This number was ₹1,600 crore at March 2026, up from ₹1,400 crore in FY25. Basically, this is other people’s money, held at no cost. Interest income on bank deposits (including forex float & others) was ₹92.9 crore in FY26, up 41% YoY.
The Forex segment has the best compounding record in the group. Since FY21, forex revenue has grown at roughly 25% CAGR and EBIT at roughly 60%, with margins going from about 30% to 46%. The demand drivers are structural. In FY26, retail remittance turnover grew 13% in holidays, 17% in education and 19% in corporate, with overall retail sales up 16%.
The travel business: four more sub-divisions
TCIL – Travel Business split
| FY26 | Revenue (₹ cr) | Growth | Basis |
| Destination Management (DMS) | 3,556 | +3% | B2B, gross |
| MICE | 1,336 | −2% | B2B, gross |
| Leisure (B2C holidays) | 1,887 | +8% | B2C, gross |
| Corporate Travel | 154 | +19% | B2B, net |
Source: Q1FY27 Investor Presentation
DMS is the biggest and least understood, because it is inbound. A French operator sells a trip to India, and Thomas Cook’s SITA or TCI handles everything on the ground. The same model runs in 28 other countries – Asian Trails in Southeast Asia, Desert Adventures in the Middle East, Private Safaris in Africa, AlliedTPro in North America.
DMS is 53% of the travel segment, and 82% of it is outside India.
MICE stands for meetings, incentives, conferences and exhibitions, which is another way of saying corporate group travel. A company rewards 300 dealers with a trip to Dubai, or a global body runs a summit across three countries, and someone has to book the flights, block the hotels and run the thing on the ground. That is the job. It is a fifth of the travel business, and almost all of it goes overseas.
Last year Thomas Cook moved more than 100,000 people across some 420 groups, 19% more than the year before but revenue still fell 2% to ₹1,336 crore. That’s because Government MICE tours went to Zero in FY26, which is not as dramatic as it sounds. Government contracts are lumpy, tender driven and fetch much lower margins so even though revenue fell, gross margins were in double digits where typically they’re 7-8%.
Travel – MICE segment split
| ₹ crore | FY25 | FY26 | Change |
| Corporate MICE | 1,256 | 1,336 | +6% |
| Government MICE | 102 | — | gone |
| Total | 1,358 | 1,336 | −2% |
Corporate Travel is the small, well-shaped one: ₹2,700 crore of GTV, around 800 clients averaging over nine years, growing 19%, with non-air services outgrowing air, which is great, because non-air carries better take rates.
DEI: the piece that needs the hardest thinking
Digiphoto puts cameras at attractions, photographs visitors and sells them the picture: 264 sites, 14 countries, 108 million captures. It is headquartered in Dubai, with the UAE alone accounting for about half its revenue.
Point to note here is that Thomas Cook owns 51%, not 100%. The accounts consolidate all of DEI’s revenue and EBIT, but 49% of the economics belongs to someone else. And the costs are largely fixed: cameras, staff and site rent owed whether visitors come or not. So, this business has significant operating leverage, which works in both directions. For example:
Digital Imaging – Historical Summarised financials
| ₹ cr | FY22 | FY23 | FY24 | FY25 | FY26 |
| Revenue | 460 | 790 | 923 | 842 | 836 |
| EBIT | (7) | 47 | 54 | 27 | 11 |
Since 2024, revenue is down by 9% but EBIT is down 80%. It got worse. In Q1 FY27 revenue fell 38% to ₹131 crore and EBIT swung from +₹10.6 crore to −₹15.2 crore, a ₹25.8 crore reversal in one quarter, mainly because of reduction in Middle East footfall.
According to group CFO Debasis Nandy, net assets employed in photo imaging are about ₹243 crore. Set FY26 EBIT of ₹11 crore against that and the return is roughly 4.5%. He also says a normal year delivers a 6–7% EBIT margin such as in FY24, with an absolute EBIT ₹54 crore. Going by the management’s perspective, FY24 was normal and today is depressed, but the question is if normal ever returns.
The Mechanics – How the Composite Scheme Works
Five companies are getting restructured into two hats:
| Company | Role in the scheme |
| Thomas Cook (India) Ltd | Demerged Company and Transferor Company |
| Sterling Holiday Resorts Ltd | Resulting Company — today a 100% TCIL subsidiary |
| TC Visa Services (India) Ltd | Transferor 1 — dormant |
| Jardin Travel Solutions Ltd | Transferor 2 — dormant |
| Borderless Travel Services Ltd | Transferor 3 — dormant |
TCIL gives a business away and absorbs three shell companies (Transferor 1 to 3) at the same time.
The four steps, outlined in the scheme of arrangement filing are as follows:
| # | Step | Detail |
| 1 | Demerger | The Resorts and Resort Management undertaking transfers from TCIL to SHRL as a going concern from the Appointed Date. SHRL issues and allots new shares to all eligible TCIL shareholders per the Share Entitlement Ratio |
| 2 | Consolidation | 4 equity shares of TCIL of ₹1 each become 1 equity share of ₹4 each |
| 3 | Amalgamation | TCVSL, JTSL and BTSL merge into TCIL and are dissolved without being wound up |
| 4 | Capital reduction | TCIL’s paid-up equity face value is cut from ₹4 to ₹3 per share. No payout to shareholders |
For every 1 equity share of TCIL you hold on the record date, you get 0.81 equity shares of Sterling Holiday Resorts Limited. You keep your TCIL shares , which is now a travel, forex and imaging company and you receive SHRL shares in your demat account.
Pre & Post Demerger shareholding change
| Holder | TCIL — pre | TCIL — post | SHRL — post (direct) |
| Promoter (Fairfax) | 63.83% | 63.83% | ~59.3% |
| Public | 36.17% | 36.17% | ~33.6% |
| TCIL (retained stake) | — | — | ~7.1% |
| Total | 100.00% | 100.00% | 100.00% |
Demerger Timelines
The Q1 FY27 presentation sets out a nine-step process flow, which clearly outlines where we are in the process.
Demerger Milestones
| Stage | Status |
| 1. Pre-scheme steps, including shift of SHRL’s registered office | ✅ Complete (SHRL EGM, 5 Jan 2026) |
| 2. Key decisions and preparation | ✅ Complete |
| 3. Board approves the Scheme | ✅ Complete (20 March 2026) |
| 4a. Application to the stock exchanges | ✅ Complete |
| 4b. Receipt of exchange approvals | ✅ Complete |
| 4c. SEBI approval | ⬜ Pending |
| 5. NCLT filing and directions for the shareholder vote | ⬜ Pending |
| 6. Shareholders’ vote | ⬜ Pending |
| 7. Final NCLT approval and effectiveness | ⬜ Pending |
| 8. Allotment of SHRL shares | ⬜ Pending |
| 9. Listing and trading of SHRL shares | ⬜ Pending |
According to the management: “The overall timeline is estimated to reach conclusion by Q1 FY28, during which Sterling will continue to be a fully consolidated segment of the TCIL Group.”
The Valuation Math — Is There Value?
DISCLAIMER: What follows is an illustrative if-then framework using peer multiples and trailing numbers. It is not a target price and not a recommendation and not a prediction. It is an if-then exercise to help readers think about how the market might value these two businesses once they trade independently.
Market capitalisation is ₹5,252 crore with a per share price of ₹112 and roughly 47 crore shares. FY26 profit attributable to owners was ₹219 crore, so the trailing P/E is roughly 24x.
That price matters to the argument, because the stock has already moved. On 31 March 2026, days after the board approved the scheme, the company was worth about ₹4,212 crore, or roughly ₹90 a share. It is up about 25% since. Some of the re-rating this piece describes has already happened.
Another interesting point to note is that the company’s own headline figure for cash and short-term investments at 31 March 2026 is ₹2,616 crore.
We cannot factor that into our valuation estimates. ₹1,600 crore of it is prepaid forex card float i.e – customers’ money. This cash is not the company’s to deploy. The real i.e “unencumbered” net cash balance is ₹771 crore.
Since ₹771 crore is already net of borrowings, enterprise value (EV) is simply ₹5,252 crore less ₹771 crore, or roughly ₹4,481 crore.
With a consolidated EBIT of ₹511 crore, the market is now paying about 8.8x EBIT for the whole thing, which is up from 6.7x in March. But this is still a blended multiple applied to a 46%-margin forex franchise and a 32-35%-margin resort chain alike. So, while the “conglomerate discount” has narrowed, it hasn’t gone.
Sum-of-the-parts (SOTP) Valuation estimates
The point of the exercise is that these businesses should not trade at a blended multiple.
Sum-of-the-parts valuation estimate
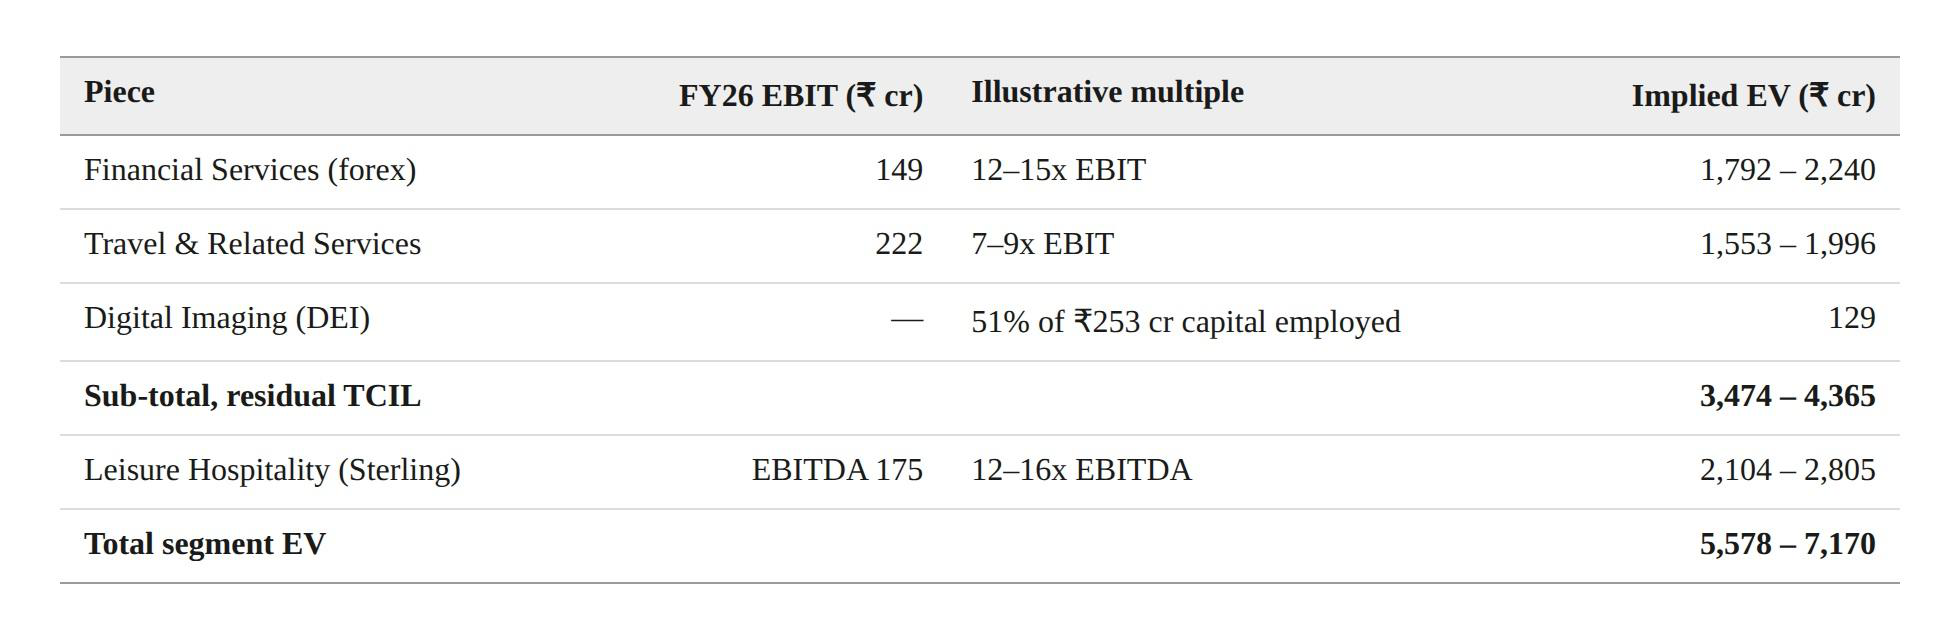
This Total Segment EV estimate needs further adjustments.
Unallocated corporate costs: Segment EBIT totals ₹511 crore but consolidated EBIT is ₹428 crore. Consolidated segment note 29(b) highlights that this is because of ‘unallocated corporate costs’. Total segment result ₹511.3 crore, less unallocated corporate expenditure of ₹83.7 crore, less finance costs. Assuming an 8x multiple, we must further deduct ₹670 crore from the above estimates.
SOTP Adjustments to estimated Enterprise Value
| Bridge to equity value | ₹ cr |
| Total segment EV | 5,578 – 7,170 |
| Less: capitalised unallocated corporate cost (₹83.7 cr × 8x) | (670) |
| Add: unencumbered net cash (already net of borrowings) | 771 |
| Equity value | 5,679 – 7,271 |
| Per share (47 crore shares) | ₹121 – ₹155 |
Against ₹112 per share as of last closing, that’s a spread of 8% to 38%.
This suggests an undervaluation. However, valuation estimates should be interpreted in context of the improving sterling resorts business, conservative multiples we have applied and the 15-18 month of demerger timeline.
All three of which must be tracked closely to see how estimated valuations fluctuate and evolve over the demerger period process.
Notes, disclaimer and disclosure
Disclaimer: The purpose of this article is only to share interesting charts, data points and thought-provoking opinions. It is NOT a recommendation. If you wish to consider an investment, you are strongly advised to consult your advisor. This article is strictly for educational purposes only.
Rahul Rao has been investing since 2014. He has helped conduct financial literacy programs for over 1,50,000 investors. He helped start a family office for a 50-year-old conglomerate and worked at an AIF, focusing on small and mid-cap opportunities. He evaluates stocks using an evidence-based, first-principles approach as opposed to comforting narratives.
Disclosure: The writer or his dependents do NOT hold shares in the securities discussed in this article. The content and interpretation of data are solely the personal views of the author.