




India’s Beauty and Personal Care (BPC) market is shifting from a largely offline, mass-market category to a more digital, premium-led one. According to a report, “India’s US$40 Bn Beauty & Personal Care Market,” by Redseer Strategy Consultants, the BPC market is projected to reach US$40 billion (around ₹3.8 lakh crore) by 2030, up from US$23 billion in FY25.
This growth would be driven by Expanding Per-Capita Beauty Spend, which is expected to rise almost 2X from US$16 to US$30 by FY31. This expansion is set to make India the 4th largest BPC market globally by 2030, behind only the US, China, and Japan. The change is also visible in how consumers discover and buy products.
Gen Z and Gen Alpha could account for nearly 50% of BPC spending by 2030, while online sales are expected to rise from around 7% of the market to 33%+. Quick commerce is adding another layer, with BPC’s share of online quick-commerce demand rising from about 2% in 2022 to 18% in 2025.
BPC is now the second-largest category in quick commerce after grocery. This shift is happening alongside rising digital consumption. E-commerce penetration in beauty and lifestyle is expected to expand around 3x by FY31. Together, these trends are changing not only the size of the BPC market, but also how consumers discover, evaluate and purchase beauty products.
Against this backdrop, this article examines India’s leading BPC companies.
#1 FSN E-Commerce Ventures: Scaling beauty through omnichannel retail and brands
FSN E-Commerce Ventures Limited (popularly known as Nykaa) is India’s leading omnichannel beauty, fashion, and lifestyle retail platform. The company’s business verticals include: Beauty Omnichannel Retail, House of Nykaa (Owned Brands), Nykaa Fashion, Superstore by Nykaa (eB2B distribution) and Nysaa (International Expansion).
Nykaa deals with 10,000+ brands across Beauty and Lifestyle, adding 160+ new brands in Q1 FY27 alone. Demand generation is fueled by a network of 170,000+ creators and 190+ lakh social media followers. Nykaa Now (delivery within 60 minutes) expanded from 3 cities to 13 cities in Q1FY27 to capture high-frequency consumer demand.
Omnichannel retail is the backbone of this business. The platform combines Online (e-commerce platform and mobile app), physical stores (over 324 stores), and Nykaa Man. Its annual transacting customer base has doubled over three years.
Within Owned Brands, the company holds a portfolio of 13 consumer brands across beauty and fashion, generating over ₹2,200 crore in annualized Net Sales Value. Key brands include Dot & Key (which crossed ₹1,000 crore in Net Sales Value to become one of India’s largest D2C skincare brands), Nykaa Cosmetics, and Kay Beauty.
Nykaa Fashion owns a multi-brand fashion platform featuring domestic and global brand partnerships (including Nike, Foot Locker, and Revolve) alongside owned fashion labels. In total, Nykaa serves over 6 crore consumers, covering 19,000+ pincodes online across India.
Omnichannel Beauty Engine: Footprint Expands to 324 Stores as Net Sales Value Jumps 29%
Accelerating Omnichannel Beauty is a key growth driver. Beauty net sales value grew 29% year-on-year to ₹2,371 crore in Q1FY27, while Beauty Gross Merchandise Value (GMV) grew 28% to ₹4,105 crore. Platform visits surged 22% to nearly 50 crore, with annual unique transacting customers crossing 200 lakh. This growth was driven by the increase in physical stores to 324.
The platform delivered double-digit same-store sales growth (SSSG). Nykaa also onboarded prestige international brand partners including Rare Beauty, SK-II, Charlotte Tilbury, Kiehl’s, and Debenhams. Strong repeat buying and premiumization among existing shoppers drove Average Order Value higher by 4.6% to ₹2,102.
Fashion Segment Turnaround: CAC Drops 30% as EBITDA Flips Positive
In addition to the Beauty business, the Fashion vertical is turning around amid expansion. Fashion Net Sales Value grew 54% year-on-year to ₹451 crore in Q1FY27, while gross merchandise value grew 53%. Emerging sub-categories saw traction: footwear (+80% GMV), activewear (+85%), and kidswear (+56%). The company has brand partnerships with Nike, Foot Locker, and Revolve.
The company launched 1,280 new brands in FY26. It also saw higher traction from international partnerships such as Nike and H&M. The Fashion segment crossed into profitability. The segment achieved an EBITDA (Earnings Before Interest, Tax, Depreciation, and Amortisation) margin of +0.1% in Q1FY27, up from -6.2% in Q1FY26 and -14.1% in Q1FY24.
The company is benefiting from the network effect as new customers increased by 44% during the quarter. Over the last two years, the Fashion business reduced Customer Acquisition Cost by 30%. Marketing and Sales & Distribution expenses as a percentage of revenue also fell by 534 bps, aiding the margin improvement.
However, the Beauty vertical is still doing the heavy lifting with a 10.3% margin.
The House of Nykaa Engine: Dot & Key Hits ₹1,300-Crore Run Rate Ahead of FY30 Goals
The portfolio of 13 owned-brand businesses’ Net Sales Value grew by 36% to ₹2,200 crore. Nykaa targets ₹5,000 crore Net Sales Value by FY30. Dot & Key reached an annualized Net Sales Value run rate of ₹1,300 crore as of Q1FY27 with high-teens EBITDA margins.
The brand is India’s largest D2C skincare brand. Another brand, “Kay Beauty,” reached an annualized run rate of ₹300 crore.
Consolidated Outperformance: Net Profit Surges 226% as Topline Hits 13-Quarter Peak
Consolidated GMV rose 34% year-on-year to ₹5,590 crore. Net revenue surged 29% to ₹2,782 crore, marking the highest growth rate in the last 13 quarters. EBITDA surged 68% to ₹236 crore, with margins at 8.5%. Net profit jumped 226% to ₹80 crore. Owned brands now contribute 19% of Beauty GMV and 8% of Fashion GMV, driving margins.
Looking ahead, Nykaa plans to scale its Nykaa Now rapid delivery service to over 25 cities by the end of FY27. The company is also expanding into Wellness. Wellness currently accounts for 10% of discretionary spending among affluent consumers, with over 80% willing to spend more on healthy lifestyles.
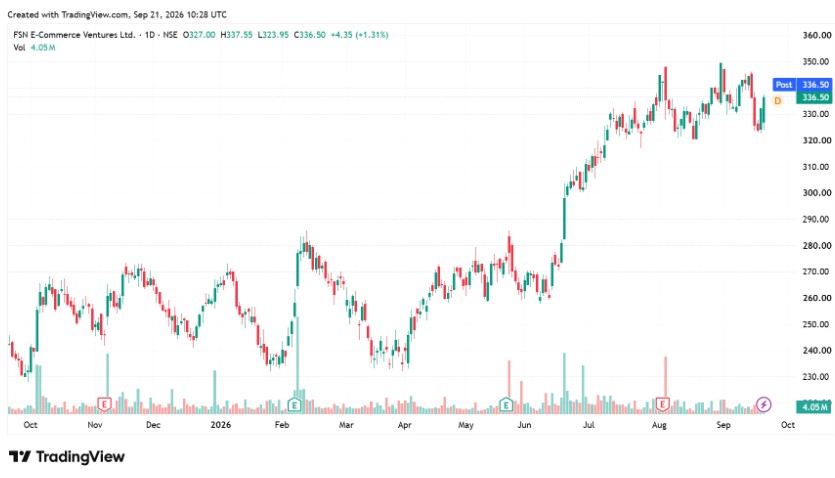
FSN E-Commerce Ventures Share Price
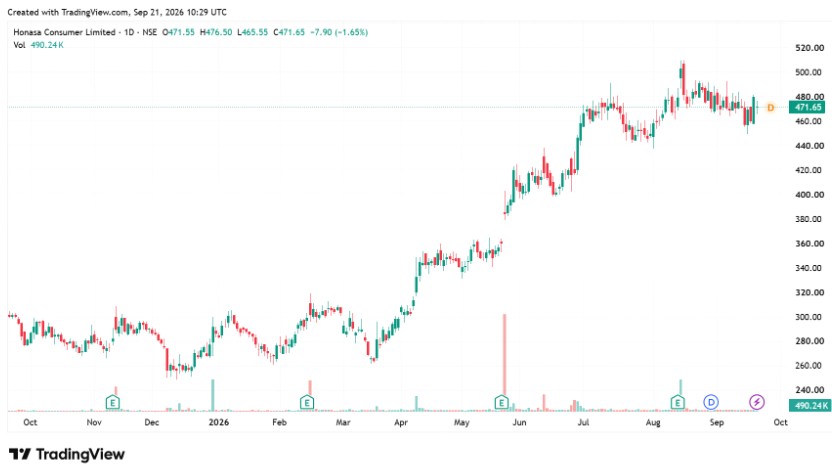
#2 Honasa Consumer: Building growth through brands and digital reach
Honasa Consumer Limited is India’s largest digital-first beauty and personal care (BPC) company. Honasa has 7 primary brands across skincare, haircare, baby care, men’s grooming, and color cosmetics. This includes Mamaearth, The Derma Co., Aqualogica, Dr.Sheth’s, BBlunt, Staze and Reginald Men & FIKN.
Beyond Mamaearth: How The Derma Co’s ₹1,000-Crore ARR Powers Honasa’s Next Leg
Mamaearth and The Derma Co. are the core brands. Both these brands drive most revenue and hold large market shares in focus categories like face wash and shampoo. The remaining brands are categorised under Younger Brands. They are growing rapidly at 30-40%. Although currently loss-making, Honasa aims to achieve contribution-margin neutrality within two years.
Revenue growth is supported by continued double-digit growth in core brands such as Mamaearth. This is complemented by the rapid scaling of newer brands, particularly The Derma Co, which has crossed ₹1,000 crore in annual revenue run rate (ARR). Honasa is entering high-growth categories, including fragrances (FIKN and Reginald Men) and wellness.
Direct Retail Reaches 300,000 Outlets as Quick Commerce Explodes
Honasa sells its products online (websites, e-commerce, and quick-delivery apps) and in physical retail stores. About 68% of sales come from online shopping, and 32% come from physical stores. Honasa focuses on categories such as face washes, sunscreens, and shampoos, which accounted for over 85% of revenue in Q1FY27.
These focus categories have delivered 35%+ year-on-year growth in Q1FY27. General Trade (GT) and Modern Trade (MT) secondary sales grew over 40% in Q1FY27. The company is expanding its direct retail reach toward 300,000+ beauty outlets. Quick commerce (like Blinkit, Instamart, and Zepto) represents Honasa’s fastest-growing fulfillment channel.
Operating Leverage Unleashed: Honasa Eyes ₹5,500-Crore FMCG Scale with 15% Margins
Quick commerce currently generates 10% of revenue. This model favors strong, search-driven consumer brands, allowing Honasa to gain significant market share. In Q1FY27, Honasa achieved like-for-like revenue growth of 31.8%, while reported revenue grew 27% to ₹756 crore.
This growth was driven by 30.5% higher volumes, reflecting strong demand momentum. EBITDA grew 139% to ₹110 crore, while margin expanded 640 bps to 14.1%. Net profit surged 119.5% to ₹90 crore. Optimized marketing spend, operating leverage, and a premium category mix (such as face cleansers and sunscreens) helped expand margins.
Honasa generated ₹83 crore in cash during Q1FY27. Management expects FY27 revenue growth to outpace its 5-year baseline CAGR target. Management expects to deliver at least 150 to 200 bps of EBITDA margin improvement over the previous year.
Honasa aims to become India’s fastest FMCG company to cross ₹5,000+ crore in revenue, targeting ₹5,500+ crore by FY31. Management expects core brands to contribute ₹3,750 crore, younger brands (₹1,500 crore), and next-horizon categories (₹250 crore) by then. Meanwhile, the margin target is 15%+ over five years.
Key Metrics at a Glance:-
| Particulars | FSN E-commerce | Honasa Consumer |
| Retail/Distribution | 324 Stores/ 523,000+ registered independent retailers | 182 Stores and other Facilities/2,70,000+ total FMCG retail outlets |
| Q1FY27 Revenue (YoY Growth) | ₹2,782 crore (+29%) | ₹756 crore (+27%) |
| Q1FY27 EBITDA (Margin) | ₹236 crore (8.5%) | ₹110 crore (14.1%) |
| Q1FY27 PAT | ₹80 crore | ₹90 crore |
| Source: Nykaa Investor Presentation, Honasa Investor Presentation | ||
The table highlights the difference in scale and profitability between the two companies. FSN E-commerce reported Q1FY27 revenue of ₹2,782 crore, nearly 3.7x Honasa’s ₹756 crore, with both companies delivering similar revenue growth of 29% and 27%, respectively.
However, Honasa reported a higher margin of 14.1% versus FSN’s 8.5%. Notably, Honasa’s PAT of ₹90 crore was higher than FSN’s ₹80 crore despite its significantly smaller revenue base.
Valuation Realities: Honasa’s Superior Return Ratios vs. Nykaa’s 360x Multiple
Honasa boasts a stronger Return on Capital Employed (ROCE) and Return on Equity (ROE) than Nykaa. Both Honasa and FSN E-commerce trade at a premium to their respective three-year industry multiples but at a discount to their 3-year historical median valuation.
Honasa trades at 60.8x earnings, compared with its three-year median of 94.2x, while FSN E-commerce trades at 360x, against a three-year median of 1052.5x. However, the current valuation, particularly of Nykaa, remains extremely elevated despite the moderation from its historical median.
Particulars | Price-to-Earnings Multiple (X) | Return Ratios | |||
| Company | 3Y Median | Industry | ROE (%) | ROCE (%) | |
| Honasa | 60.8 | 94.2 | 36.7 | 15.7 | 19.2 |
| FSN E-commerce | 360.0 | 1052.5 | 50.9 | 15.3 | 17.2 |
| Source: Screener.in (As of 21 September 2026) | |||||
India’s BPC market is entering a phase where digital adoption, premiumisation and changing consumer preferences are expected to drive growth. Nykaa is expanding its omnichannel beauty platform and owned-brand portfolio, while Honasa is scaling Mamaearth, The Derma Co and its younger brands. Both businesses are also seeing greater traction from quick commerce.
Nonetheless, you can keep these companies on your watchlist.
Disclaimer
Note: Throughout this article, we relied on data from http://www.Screener.in and the companies’ investor presentations. We used an alternative, widely accepted source only when the data were unavailable.
The purpose of this article is only to share interesting charts, data points, and thought-provoking opinions. It is NOT a recommendation. If you wish to consider an investment, we strongly advise you to consult your advisor. This article is strictly for educational purposes only.
About the Author: Madhvendra has been deeply immersed in the equity markets for over seven years, combining his passion for investing with his expertise in financial writing. With a knack for simplifying complex concepts, he enjoys sharing his honest perspectives on startups, listed Indian companies, and macroeconomic trends.
A dedicated reader and storyteller, Madhvendra thrives on uncovering insights that inspire his audience to deepen their understanding of the financial world.
Disclosure: The writer and his dependents do not hold the stocks discussed in this article.
The website managers, their employees (s), and contributors/writers/authors of articles have or may have an outstanding buy or sell position or holding in the securities, options on securities, or other related investments of issuers and/or companies discussed therein. The articles’ content and data interpretation are solely the personal views of the contributors/ writers/authors. Investors must make their own investment decisions based on their specific objectives and resources, and only after consulting any independent advisors as necessary.