




Rising promoter ownership can signal confidence in a company’s prospects. A larger stake increases promoters’ exposure to the business’s gains and losses. Investors therefore track these changes for clues about how those closest to the company view its future.
This signal matters in SME stocks too. Tracking promoter holdings across reporting periods reveals different patterns. Some companies show sharp consecutive increases. Others record gradual gains over a longer period. We examined these changes alongside growth, profitability and debt levels.
We screened SME companies with a market capitalisation above Rs 100 crore. Return on capital employed (ROCE) had to exceed 15%. Its three-year average also had to exceed 15%. We required three-year annualised sales and profit growth above 10% each. Operating margins had to exceed 10%. Debt-to-equity had to stay below 0.5. Operating cash flow had to be positive in the latest financial year. Debtor days had to remain below 150.
We also required more than 100 shareholders. Promoter ownership had to exceed 30%, with no pledged promoter shares. The initial screen allowed stable or rising holdings. Nine companies showed an increase in promoter ownership.
We excluded five. Three had only a single observed increase and too little history to establish a pattern. Two others showed virtually flat holdings or an isolated, negligible uptick.
That left four companies with repeated increases across reporting periods. These include both clearer recent additions and smaller, gradual gains. The strength of the ownership signal therefore varies across the four.
#1 Canarys Automations: Fortira Acquisition Pushes Promoter Stake to 58.16%
Incorporated in 1991, Canarys Automations is in the business of software & hardware development, consultancy services, electronic equipment, and handling water management system turnkey projects.
Canarys Automations’ promoter holding rose from 56.62% in March 2025 to 57.28% in September. It reached 58.16% in March 2026, according to Screener. This rising stake places it among the SMEs selected through our screen.
Canarys Automations Shareholding Data
| Mar-24 | Sep-24 | Mar-25 | Sep-25 | Mar-26 |
| 56.59% | 56.59% | 56.62% | 57.28% | 58.16% |
Fortira Acquisition and US Expansion Drive Revenue Scaling
Its three-year sales and profit CAGRs stood at 39% and 17%, respectively. ROCE was 22.6%.
Its annual report records the April 2025 acquisition of a 51% stake in US-based Fortira. The transaction expanded its North American presence and enterprise customer base. International markets contributed about 48% of FY26 revenue.
The July earnings-call transcript records an order book of approximately Rs 441 crore. Most projects span three years, with some extending into a fourth year.
Management is also pursuing subscription revenue through AURYIS, its compliance and drug-safety platform. India and the US are the initial markets. Europe and Asia-Pacific are planned later. FY26 involved development and pilots. Management expects products to take 18–24 months to scale. Its CAR framework applies AI to customers’ existing software systems.
The annual report shows FY26 consolidated revenue rising 122.4% year-on-year (YoY) to Rs 198.1 crore. Fortira’s consolidation contributed to this expansion. Net profit attributable to shareholders increased 48.6% to Rs 12.32 crore. Operating margin was 11%. Management attributed weaker consolidated margins to investments in talent, technology and integration of the acquisition. Debt-to-equity was approximately 0.09x.
Operating cash flow was Rs 6.55 crore. Debtor days of 148 make collections important. Management expects Fortira’s margins to improve over 12–18 months. Product adoption and execution remain key. SME lot sizes, potentially limited liquidity and half-yearly reporting warrant caution.
Canarys Automations Financial Performance
| Metric | FY26 |
| Revenue | Rs 198.1 crore |
| Revenue growth | 122.4% YoY |
| Net profit attributable to shareholders | Rs 12.3 crore |
| Profit growth | 48.6% YoY |
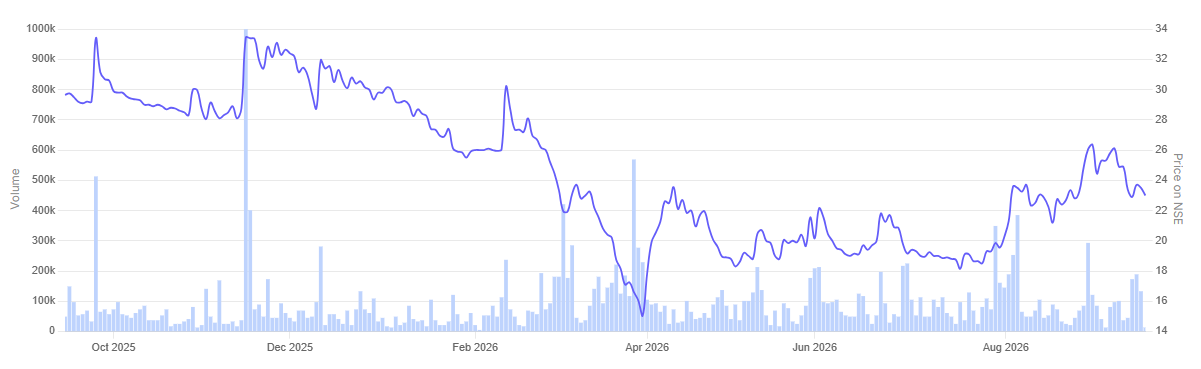
In the past year, the share price of Canarys Automations is down 21.9%.
Canarys Automations 1-Year Share Price Chart
#2 Gayatri Rubbers and Chemicals: Railway Orders and Margin Expansion Lift Stake to 74.03%
Incorporated in 2022, Gayatri Rubbers and Chemicals is in the business of rubber manufacturing and trading.
Gayatri Rubbers and Chemicals’ promoter holding reached 74.03% in March 2026, according to Screener. It rose from 73.56% in September 2025, after remaining at 73.37% for two years.
Gayatri Rubbers and Chemicals Shareholding Data
| Mar-24 | Sep-24 | Mar-25 | Sep-25 | Mar-26 |
| 73.37% | 73.37% | 73.37% | 73.56% | 74.03% |
Plant 2 Scale-Up and RDSO Approvals Fuel Margin Gains
Three-year sales and profit CAGRs of 23% and 83% support its inclusion among our selected SMEs. RoCE stood at 37.9%.
Its FY26 annual report attributes growth to specialised railway and smart-meter components. A Rs 1.2 crore BEML gasket order offers scope for repeat business after certification. Management expects Plant 2 utilisation to rise from 30% to 70–80% over 18–24 months.
In the May earnings call, management said a key Plant 2 product remained under developmental RDSO approval. Regular supplier status was expected in about a year. Plant 1 could reach 90–95% utilisation through longer shifts and additional labour, without fresh capex.
Also, an August 21 company release also disclosed an ISRO pilot order for EPDM rubber. Further business depends on successful deployment and qualification.
FY26 operating revenue rose 31% YoY to Rs 41.8 crore. Net profit increased 96% YoY to Rs 5.6 crore. A shift towards higher-margin products lifted the operating margin to 21.1%.
The balance sheet implies debt-to-equity of about 0.35 times. Debtor days stood at 82. However, operating cash flow was only Rs 0.16 crore. Better collections and inventory turnover will matter as production expands.
Investors should also account for SME trading lots and potentially limited liquidity. The company reports half-yearly results, leaving longer gaps between financial updates.
Gayatri Rubbers and Chemicals Financial Performance
| Metric | FY26 |
| Revenue | Rs 41.8 crore |
| Revenue growth | 31% YoY |
| Net profit | Rs 5.6 crore |
| Profit growth | 96% YoY |
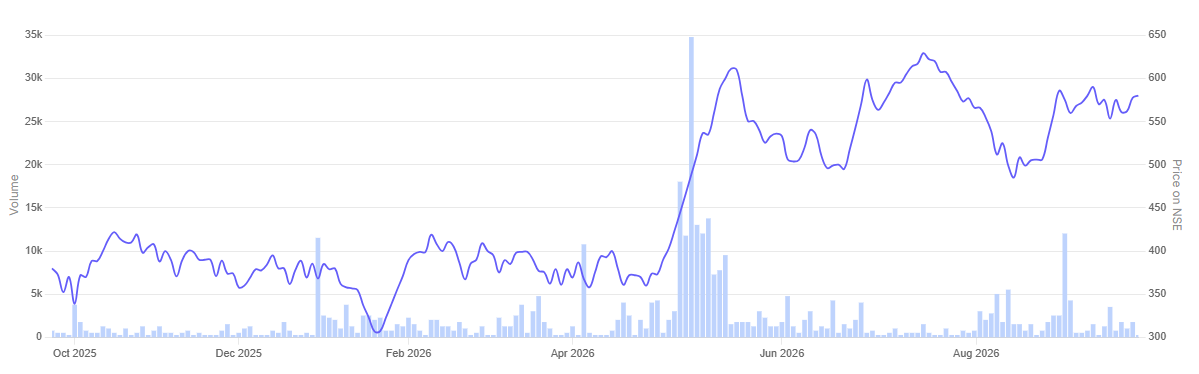
In the past year, the share price of Gayatri Rubbers and Chemicals rallied 52.6%.
Gayatri Rubbers and Chemicals 1-Year Share Price Chart
#3 Systango Technologies: Modest Insider Accumulation Backed by 38% Operating Margins
Incorporated in 2007, Systango Technologies deals in supplying software and development services.
Systango Technologies’ promoter holding edged up to 72.17% in March 2026, from 71.96% in March 2023, according to Screener. The increase was modest at 0.21 percentage points.
Systango Technologies Shareholding Data
| Mar-24 | Sep-24 | Mar-25 | Sep-25 | Mar-26 |
| 71.96% | 72.04% | 72.07% | 72.13% | 72.17% |
AI and Cloud Alliances Anchor Recurring Revenue Growth
Three-year sales and profit CAGRs of 20% and 32% support its inclusion among our selected SMEs.
Its June investor presentation outlines a push into AI and cloud services. An Alibaba Cloud alliance covers cloud migration and managed AI solutions. Its GenAI Studio targets AI project delivery within 12–16 weeks. Managed services and software licensing offer recurring revenue alongside project fees.
The FY26 annual report identifies the US, UK and Europe as priorities for client acquisition. Systango is also exploring acquisitions to strengthen its technology capabilities and overseas presence.
FY26 consolidated operating revenue rose 34.6% YoY to Rs 90.4 crore. Net profit increased 34.3% YoY to Rs 31.9 crore. Operating margins stood at approximately 38%, while RoCE was 33%.
Debt-to-equity was close to zero. Debtor days fell to 48 from 84 a year earlier. Operating cash flow reached Rs 33.77 crore, exceeding reported profit.
Further growth will depend on converting AI and cloud opportunities into sustained client work. Investors should also account for SME trading lots and potentially limited liquidity. Half-yearly reporting leaves longer gaps between financial updates.
Systango Technologies Financial Performance
| Metric | FY26 |
| Revenue | Rs 90.4 crore |
| Revenue growth | 34.6% YoY |
| Net profit | Rs 31.9 crore |
| Profit growth | 34.3% YoY |
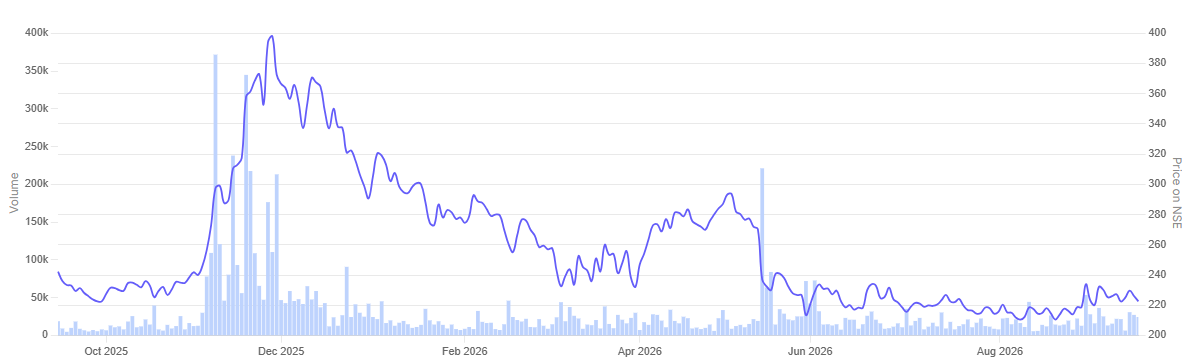
In the past year, the share price of Systango Technologies is down 8.7%,
Systango Technologies 1-Year Share Price Chart
#4 Chandan Healthcare: Shifting Capital to Diagnostics as Promoter Holding Nears 50%
Incorporated in September 2003, Chandan Healthcare runs diagnostic centers in North India with pathology and radiology testing services.
Chandan Healthcare’s promoter holding rose to 49.61% in June 2026, from 49.43% in March 2025, according to Screener. The increase was modest at 0.18 percentage points.
Chandan Healthcare Shareholding Data
| Mar-25 | Sep-25 | Dec-25 | Mar-26 | Jun-26 |
| 49.43% | 49.47% | 49.47% | 49.55% | 49.61% |
Franchise Expansion and Diagnostic Shift Drive Margin Optimization
Its screening data show three-year sales and profit CAGRs of 26% and 79%, supporting its selection.
At the August earnings call, management targeted 1,000 franchises by March 2027, against 264 in June 2026. Franchisees fund their outlets, limiting Chandan’s upfront investment. Management also expected eight comprehensive diagnostic centres to open by December 2026.
The company announced the sale of its 53.56% stake in Chandan Pharmacy for Rs 16.77 crore. Management plans to deploy the proceeds into diagnostics, shifting capital towards higher-margin services.
According to its Q1 FY27 investor presentation, consolidated income rose 19.6% YoY to Rs 82.3 crore. Net profit attributable to shareholders increased 29.5% to Rs 7.5 crore. RoCE stood at 23.1%. Debt-to-equity was approximately 0.32 times. However, debtor days of 114 make collections a key monitor. Management said government customers typically paid in about four months.
Expansion will depend on timely centre openings and higher test volumes. SME trading lots and potentially limited liquidity warrant caution.
Chandan Healthcare Financial Performance
| Metric | Q1 FY27 |
| Total income | Rs 82.26 crore |
| Total income growth | 19.6% YoY |
| Net profit attributable to shareholders | Rs 7.50 crore |
| Profit growth | 29.5% YoY |
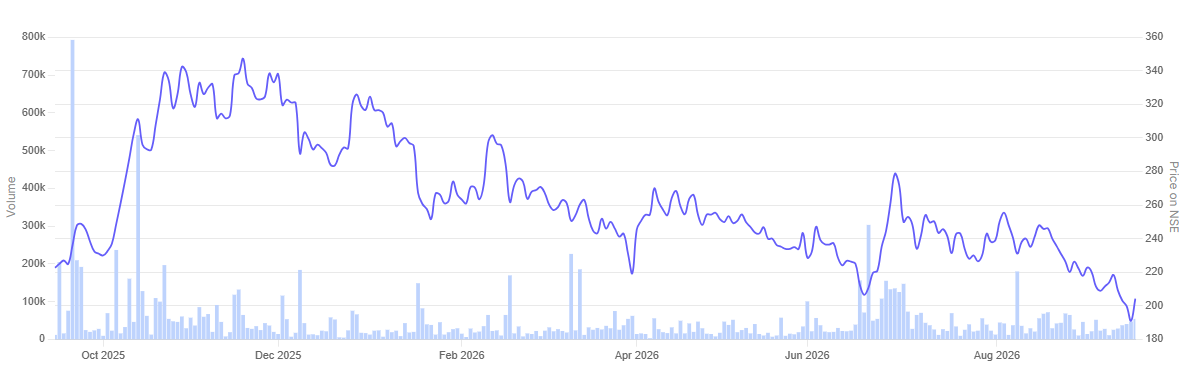
In the past year, the share price of Chandan Healthcare is down 7.9%.
Chandan Healthcare 1-Year Share Price Chart
Conclusion
Rising promoter ownership gives these four SMEs a common thread. The strength of that signal varies. Repeated recent increases carry a different message from small additions spread over several years. The financial screen adds context through growth, returns on capital and debt levels.
The focus now shifts to execution. New facilities, customer contracts and expansion plans need to translate into earnings and cash flow. Collections and the funding required for growth will remain important.
Promoter holding is therefore one part of the assessment. Business performance, valuation and cash generation deserve equal attention. SME trading lots and potentially limited liquidity also matter, particularly when investors need to exit.
Four SMEs with Rising Promoter Stakes: Growth and Operating Performance
| Metric | Canarys Automations | Gayatri Rubbers and Chemicals | Systango Technologies | Chandan Healthcare |
| Three-year sales CAGR | 39% | 23% | 20% | 26% |
| Three-year profit CAGR | 17% | 83% | 32% | 79% |
| FY26 operating margin | 11% | 21.1% | 38% | 21% |
| FY26 debtor days | 148 | 82 | 48 | 114 |
| FY26 operating cash flow (Rs crore) | 6.55 | 0.16 | 33.77 | 16.17 |
Chandan’s FY26 operating margin is 21% in Screener’s annual data. The 20% figure refers to its trailing twelve-month margin.
You can track how these are progressing by adding stocks to your watchlist.
Disclaimer:
Note: We have relied on data from www.Screener.in throughout this article. Only in cases where the data was not available, have we used an alternate, but widely used and accepted source of information.
The purpose of this article is only to share interesting charts, data points and thought-provoking opinions. It is NOT a recommendation. If you wish to consider an investment, you are strongly advised to consult your advisor. This article is strictly for educative purposes only.
Ekta Sonecha Desai has a passion for writing and a deep interest in the equity markets. Combined with an analytical approach, she likes to deep dive into the world of companies, studying their performance, and uncovering insights that bring value to her readers.
Disclosure: The writer and her dependents do not hold the stocks discussed in this article.
The website managers, its employee(s), and contributors/writers/authors of articles have or may have an outstanding buy or sell position or holding in the securities, options on securities or other related investments of issuers and/or companies discussed therein. The content of the articles and the interpretation of data are solely the personal views of the contributors/ writers/authors. Investors must make their own investment decisions based on their specific objectives, resources and only after consulting such independent advisors as may be necessary.