




For rural-focused lenders, FY27 will be a tricky one. The monsoon has been erratic across India, with some parts receiving surplus rainfall and some states like Andhra Pradesh and Bihar recording a rainfall deficit of up to 42%. As per IMD, this year’s monsoon (so far) has been the weakest in 17 years.
That matters for rural-focused NBFCs because farm income and rural cash flows can have a direct bearing on loan repayments, particularly in segments such as tractor and rural business finance.
Against this backdrop, two rural-facing NBFCs, Mahindra & Mahindra Financial Services (MMFS) and L&T Finance (LTF), have posted their strongest Q1FY27 numbers. Both have seen improvement in growth, asset quality, and profitability. Here, the question is not about who grew faster, but whose business model is resilient enough to absorb the shock of a patchy monsoon better. And whether the market is pricing that difference correctly.
MMFS: The Recovery is Working, But the Book is Getting More Tractor-heavy
Mahindra & Mahindra Financial Services (MMFS), widely recognized as India’s largest rural NBFC, is showing signs of a meaningful turnaround. In Q1FY27, consolidated net profit rose 75% YoY to ₹927 crore, supported by a 23.4% increase in net interest income, a 430 bps improvement in the cost-to-income ratio and 40 bps lower credit costs.
The strong quarter was also reflected in loan growth. MMFS recorded its highest-ever disbursements of ₹15,564 crore, up 22% YoY, taking AUM 13% higher to ₹1.46 lakh crore.
Mahindra & Mahindra Financial Services: Financial Performance
| Period | Q1FY26 | Q1FY27 | YoY Growth (%) |
| Net Interest Income (₹ crore) | 2,711 | 3,346 | 23.4% |
| Net Interest Margin (%) | 6.7% | 7.3% | 60 bps |
| Profit After Tax (₹ crore) | 529 | 927 | 75.2% |
| Cost-to-income Ratio (%) | 40.8% | 36.5% | 430 bps |
| Return on Assets (%) | 1.6% | 2.4% | 80 bps |
| Credit Cost (%) | 1.9% | 1.5% | 40 bps |
The business is also becoming more diversified, with 17% of the total lending book now accounting for non-wheels business, including housing finance. However, the bigger change is visible in asset quality and profitability.
Growing Lending Book
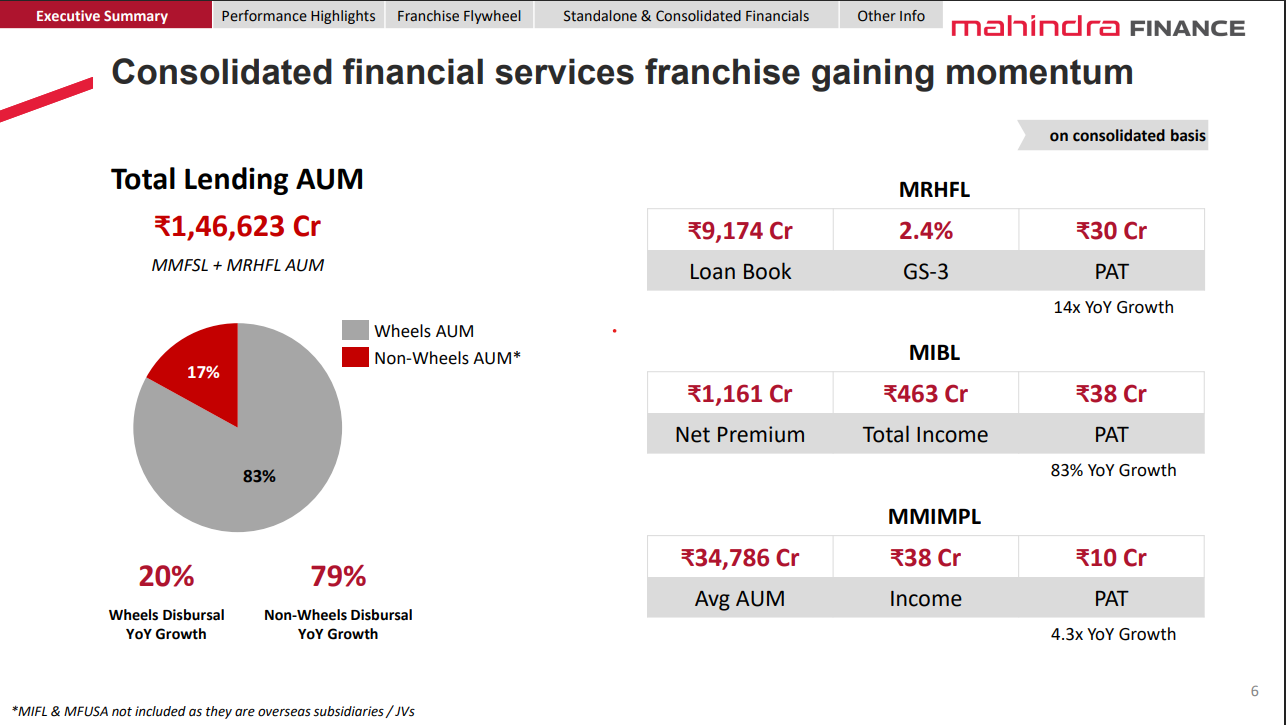
Return on assets (RoA) rose to 2.4%, while gross stage-3 (loans overdue for more than 90 days) assets fell to 3.5%. Combined gross stage-2 (loans overdue by 31 to 89 days) and gross stage-3 is at 8.3%, which is an eight-year low. Improving earnings and asset quality is making this recovery more meaningful.
Buffers to Absorb Shocks
MMFS has also built some cushion against shocks. A ₹217 crore macro overlay, ₹5,000-5,500 crore of liquidity, and a Tier-1 capital ratio of 16.5%. But there is a catch. The strongest part of MMFS’s growth is also one of the parts most exposed to the monsoon.
Tractor finance jumped 45% YoY to ₹2,480 crore in Q1. Delayed monsoons extended the purchase cycle, while strong rabi cash flows helped customers fund their margin money.
That makes tractor collections the key number to watch. MMFS entered the monsoon with stronger asset quality and lower credit costs, but a patchy harvest could put those gains to the test. The next few quarters will show whether the turnaround can hold when rural cash flows come under pressure.
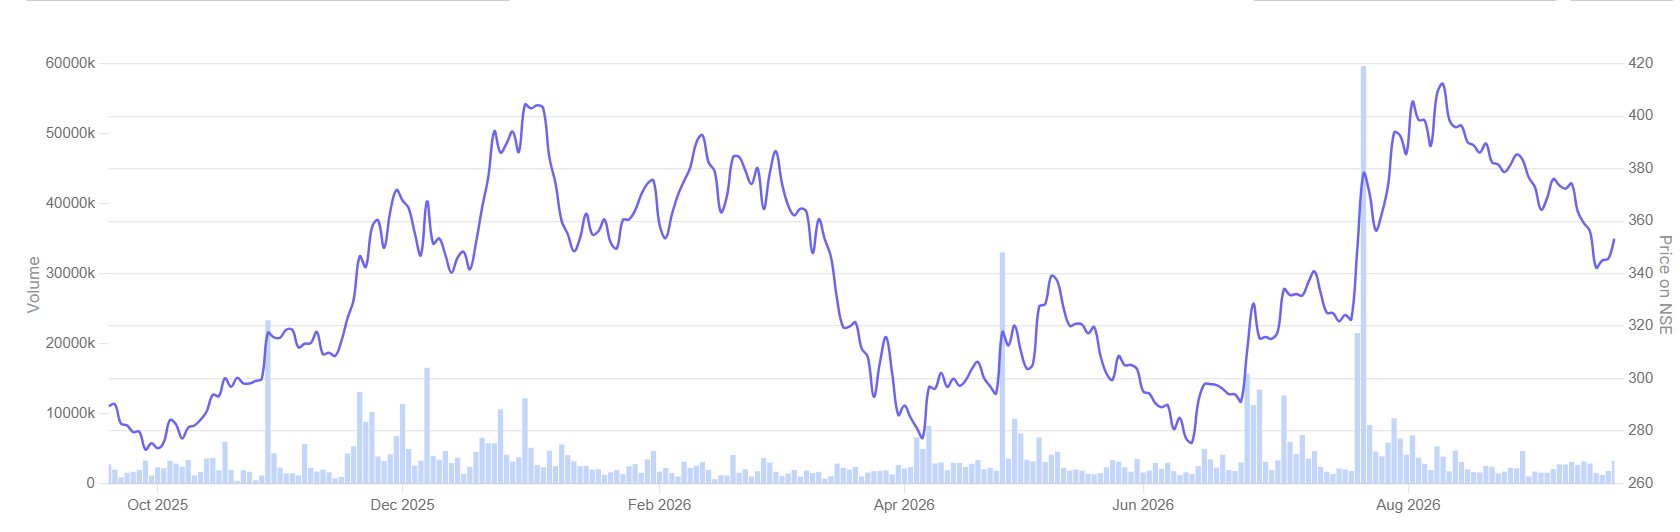
M&M Financial Services: 1 Year Stock Chart
L&T Finance: More Diversification, but the Credit-cost Gap Remains
L&T Finance (LTF) is taking a very different route to growth. With more than 40% of its loan book tied to the rural economy, the company’s consolidated net profit rose nearly 29% YoY to ₹902 crore in Q1FY27, its highest-ever quarterly profit. Net interest income also grew by nearly 31% to ₹2,684 crore.
LTF’s core asset quality is structurally improving. Consolidated Gross Stage 3 dropped to 2.86% in Q1FY27, from 3.29% in Q4FY25. Net Stage 3 assets (loan overdue by more than 90 days) dropped to 0.9% from 0.97% during the same period.
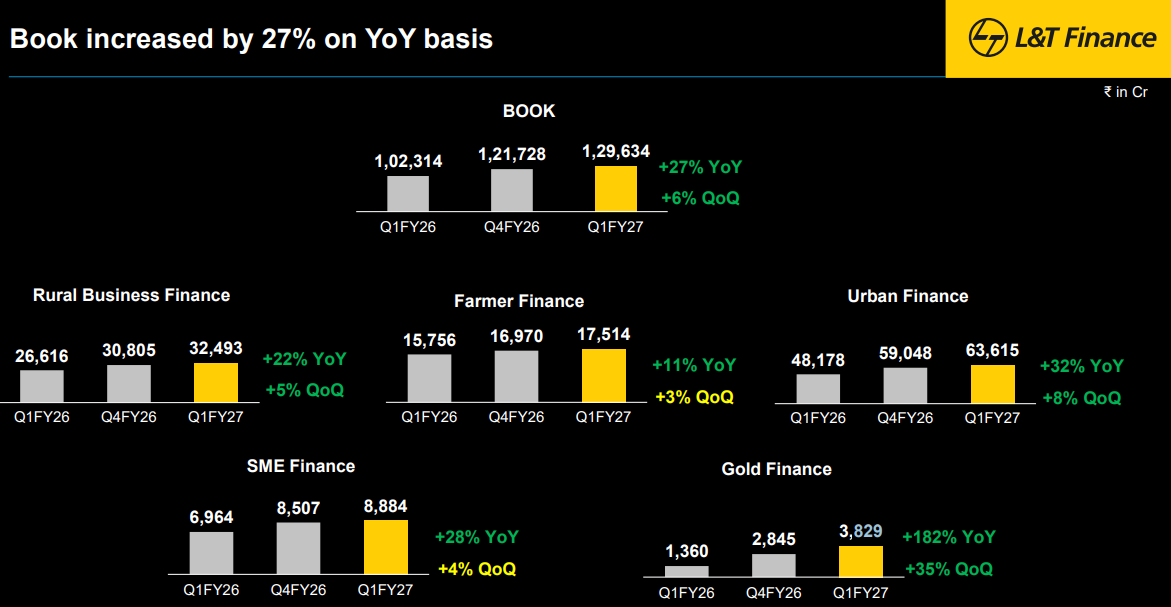
At the same time, its consolidated loan book grew 27% to ₹1,29,634 crore, with retail lending now accounting for 98% of the book.
L&T Finance: Financial Performance
| Period | Q1FY26 | Q1FY27 | YoY Growth (%) |
| Net Interest Income (₹ crore) | 2,054 | 2,684 | 30.7% |
| Net Interest Margin (%) | 8.24% | 8.54% | 30 bps |
| Net Profit (₹ crore) | 701 | 902 | 28.7% |
| Credit Cost (%) | 3.43% | 2.54% | 90 bps |
| Return on Assets (%) | 2.37% | 2.48% | 11 bps |
The important part is that growth is not coming from a single segment. During the quarter, personal loan disbursements jumped 126% to ₹4,380 crore, two-wheeler finance grew 41% to ₹3,006 crore, while rural business finance and SME finance increased 24% and 23%, respectively. Gold loans were another fast-growing segment, with the book expanding 182% YoY to ₹3,829 crore.
L&T Finance Diversified Loan Book
The improvement is driven by discipline in the lending process and stronger portfolio monitoring. It has been using an AI-based underwriting engine, Project Cyclops, to strengthen its borrower quality. In two-wheeler finance, the system has helped increase the share of prime borrowers from 52% to 90%. So far, the strategy is translating into better returns. RoA improved to 2.48%.
One number is still not under control for LTF: credit cost, which has declined by 10 basis points sequentially to 2.54%. It remains above LTF’s long-term target of below 2%. MMFS is already operating with credit costs below its target range, while LTF is still waiting for that part of the turnaround to come through.
LTF does have a broader business mix. Gold loans, for instance, can see demand rise when households need liquidity during periods of weaker income. Urban and personal lending also reduce dependence on agricultural cash flows.
But diversification should not be confused with insulation. Rural business finance and micro-LAP remain meaningful parts of the book. A weaker agricultural cycle can therefore still affect collections, even if gold and urban businesses soften the impact.
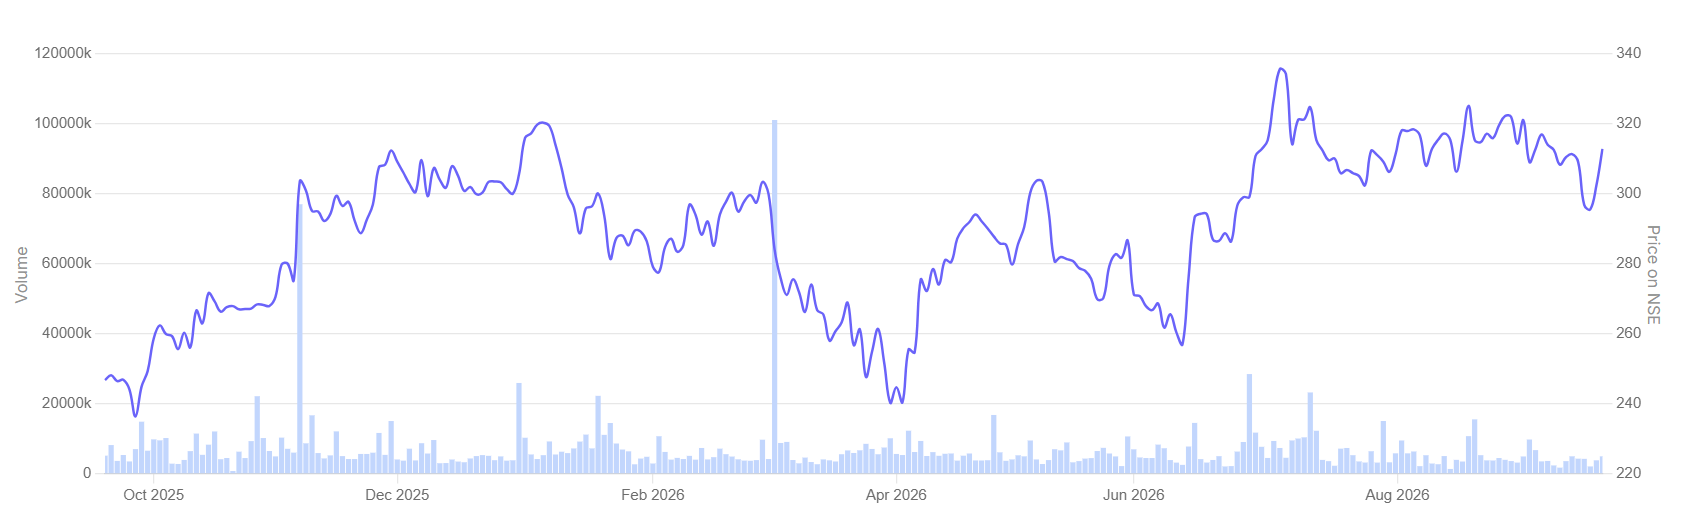
L&T Finance: 1 Year Stock Price
Valuation: LTF Carries the Bigger Premium
The P/B comparison brings out a clear difference between the two stocks. The valuation gap is significant. MMFS is trading close to its five-year median P/B and industry median, while LTF is at a premium to both its historical and industry median by a wide margin.
Valuation Trend
| Metrics | P/B | 5-yr Median | Industry Median |
| M&M Financial Services | 1.8 | 1.9 | 1.85 |
| L&T Finance | 2.8 | 1.6 |
For investors, the takeaway is simple: LTF’s faster and diversified growth comes with a much higher valuation bar. Its retail growth and improving RoA need to continue for the premium to hold, particularly as credit cost remains above 2%.
MMFS, meanwhile, is trading near its historical valuation despite its RoA improving to 2.4% and credit cost falling to 1.5%. The key question here is whether the turnaround can sustain through a weaker rural cycle, especially with tractor finance growing rapidly.
So, the valuation comparison is less about which stock is cheaper and more about which business can deliver the earnings and return improvement already being reflected in its P/B.
The Big Monsoon Test
Both companies have entered FY27 with stronger earnings momentum than they had a year ago. Asset quality has improved, profitability is moving higher, and the retail/rural lending opportunity remains intact.
But the next phase of the recovery will be less about what happened in Q1 and more about what happens to collections over the next two quarters. For MMFS, investors need to watch whether the sharp growth in tractor finance translates into sustainable collections despite uneven rainfall.
For LTF, the watchlist is slightly different: whether credit cost can move towards the company’s sub-2% target while the retail book continues to grow at a high rate.
With rainfall 15% below the long-period average, the monsoon risk has not disappeared from the earnings story. It has simply moved from the weather page to the collection numbers. Add these stocks to your watchlist and monitor how they execute their growth plans.
Disclaimer:
Note: We have relied on data from www.Screener.in throughout this article. Only in cases where the data was not available, have we used an alternate, but widely used and accepted source of information.
The purpose of this article is only to share interesting charts, data points, and thought-provoking opinions. It is NOT a recommendation. If you wish to consider an investment, you are strongly advised to consult your advisor. This article is strictly for educational purposes only.
Deepan Datta has spent over a decade studying stocks and mutual funds. His passion is to uncover interesting stories in the financial markets and share them through his writings with investors at large. He is focused on delivering clear, easy-to-understand, and research-backed insights. Deepan began his career as a Research Associate at S&P Global, where he developed a strong foundation in financial research and data analysis.
Disclosure: The writer and his dependents do not hold the stocks discussed in this article.
The website managers, their employees (s), and contributors/writers/authors of articles have or may have an outstanding buy or sell position or holding in the securities, options on securities or other related investments of issuers and/or companies discussed therein. The content of the articles and the interpretation of data are solely the personal views of the contributors/ writers/authors. Investors must make their own investment decisions based on their specific objectives, resources and only after consulting such independent advisors as may be necessary.