




Why Standard Dividend Screening Fails in Indian Markets
Most dividend screens in India work the same way. Sort by yield, filter for low debt, stop there. It is a fast way to build a list and a slow way to lose money. Yield alone says nothing about whether the cash behind it is growing or shrinking.
The payout ratio is the more honest number. A company handing back 90% of its profit is saying it cannot find anything better to do with the money. One handing back 60% while growing profit at a mid-teens rate is saying something quite different. Both can be good investments. They are not the same investment.
Now, before we dive into this, let me be clear. The stocks we are going to discuss do not include the investor favourite, Mahindra and Mahindra (M&M). The two companies inside the Mahindra Group that do make that contrast unusually clean right now. One is a Nifty 50 technology business whose dividend has done nearly all the heavy lifting for five years. The other is a small-cap engine maker in Mohali compounding profit at 16% a year while still sending two-thirds of it out of the door.
#1 Tech Mahindra: Decoding a 94% Payout Ratio
Incorporated in 1986 as a joint venture between Mahindra and Mahindra and Britain’s BT Group, Tech Mahindra is today the country’s fifth-largest listed IT services firm by market value. It sells application development, consulting and managed services, with a heavy historical skew towards telecom clients.
The company carries a market cap of Rs 1,52,792 cr. Its shares closed at Rs 1,558 on 16th September 2026, roughly 16% below the 52-week high of Rs 1,854 and well above the low of Rs 1,304.
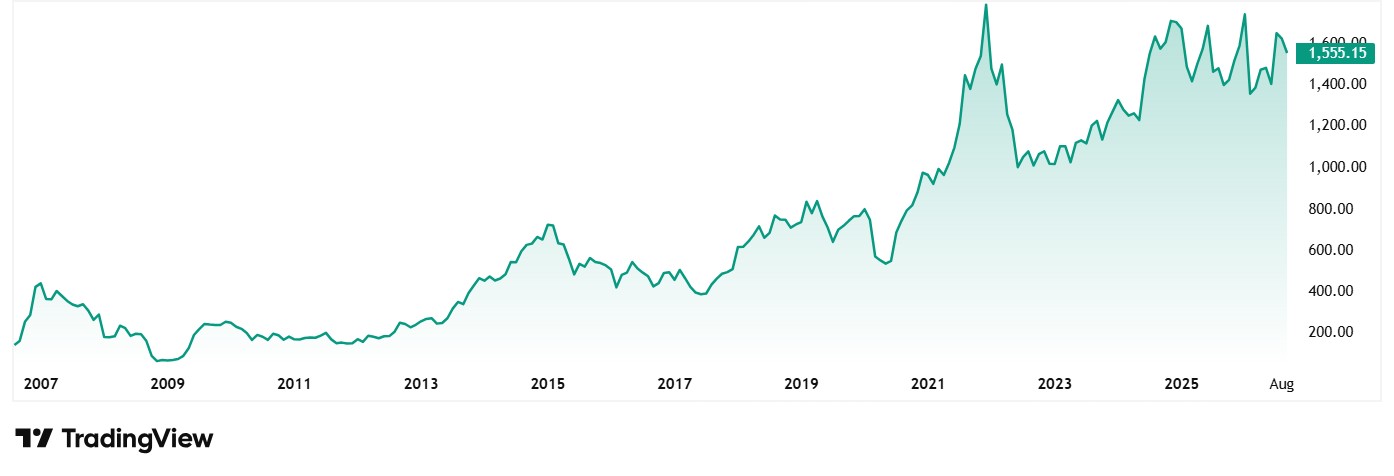
The stock trades at a PE multiple of 29x against the industry median of 20x. The 10-Year median PE for the stock is 21x while the industry median for the same period is 23x.
Borrowings stood at Rs 2,186 cr at the end of FY26 against shareholder funds of Rs 29,616 cr. That is a debt-to-equity ratio of about 0.07, most of it lease obligations rather than bank debt.
Inside Tech Mahindra’s Record FY26 Dividend Yield
For FY26 the board declared a total dividend of Rs 51 per share. Rs 15 came as an interim payout in November 2025 and Rs 36 as a final dividend, with a record date of 3rd July 2026. It is the highest annual dividend the company has ever declared, up over 13% on the Rs 45 paid for FY25. Against the closing price, that works out to a yield of 3.3%.
Here is the part that deserves attention. That Rs 51 absorbed 94% of the year’s profit. The company earned Rs 4,806 cr and sent roughly Rs 4,519 cr of it to shareholders.
In FY24 the payout ratio was 150%, meaning the dividend exceeded the profit outright. Now set that against growth. Over the five years to FY26, sales compounded at 8.5% a year. Operating profit managed 5.9%. Net profit compounded at just 2.0%.
| FY | FY21 | FY22 | FY23 | FY24 | FY25 | FY26 | 5Y CAGR | Q1FY27 |
| Sales/Rs cr | 37,855 | 44,646 | 53,290 | 51,996 | 52,988 | 56,815 | 8.5% | 15,712 |
| EBITDA/Rs cr | 6,796 | 8,020 | 7,763 | 4,506 | 6,964 | 9,033 | 5.9% | 2,738 |
| Net Profit/Rs cr | 4,353 | 5,630 | 4,857 | 2,397 | 4,253 | 4,806 | 2.0% | 1,486 |
Source: Screener.in
EBITDA refers to operating profit before other income. The five-year lines hide a violent middle. FY24 was the trough, when operating profit collapsed to Rs 4,506 cr and net profit halved to Rs 2,397 cr. Measured from FY24, the recovery looks spectacular. Measured from FY21, it looks like five years spent getting back to where the company started.
Margin Recovery vs. Treasury Drag: The True Profit Driver
The turnaround itself is not in doubt. Operating margin has climbed from 9% in FY24 to 16% in FY26, and reached 17% in the June 2026 quarter. Return on capital employed has gone from 12% to 23% over the same stretch.
The June 2026 quarter was the strongest print in years. Revenue came in at Rs 15,712 cr, up nearly 18% on the same quarter a year earlier. Operating profit reached Rs 2,738 cr. New deal wins totalled 1,078 million dollars, a third higher than a year ago and the third straight quarter above the billion-dollar mark.
One figure deserves flagging. Other income for FY26 was negative Rs 240 cr, and negative again at Rs 106 cr in the June quarter. For most IT majors, other income is a cushion from treasury holdings. Here it has become a drag. The profit growth is coming from the operating line, not the treasury desk. That is the harder and better way to earn it.
The 5-Year Tech Mahindra Share Price Stagnation
Over five years the share price has compounded at 1% a year. Over ten years, 13%. Strip out the dividend and half a decade of holding this stock has returned close to nothing. The yield has been the return.
The register has shifted underneath that. Foreign institutional holding has fallen from 26.87% in March 2023 to 18.66% by June 2026. Domestic institutions went the other way, from 25.68% to 36.92%. Promoter holding sits at 34.96%.
The risk is straightforward. If the margin recovery stalls short of the 15% management is targeting for FY27, a 94% payout on a flat profit base becomes uncomfortable quickly. The dividend is affordable today. It is not obviously growable.
#2 Swaraj Engines: The Hidden Small-Cap Compounding at 16%
Incorporated in 1985, Swaraj Engines was set up jointly by Punjab Tractors and Kirloskar Oil Engines to build diesel engines for Swaraj tractors. Mahindra and Mahindra bought control of Punjab Tractors in 2007 and folded the brand into its farm division. In September 2022 Kirloskar Industries sold its remaining 17.41% to Mahindra, and the company became a subsidiary. Mahindra held 52.11% as of 31st March 2026, with no shares pledged.
The business is unusually simple. It builds engines in the 20 to 65 horsepower range and sells almost all of them to one customer. That dependence is the obvious risk.
Q1FY27 Boom: 56,803 Engines and a Record Market Share
The June 2026 quarter was the best in the company’s history. Revenue rose 21.5% to Rs 588.39 cr. Profit before tax hit Rs 74.64 cr, the highest the company has ever reported in a quarter. Net profit came in at Rs 55.53 cr, up 11.1%. Engine volumes reached 56,803 units, a record, and cumulative supply since 1989 crossed two million engines.
The demand behind that is visible in the tractor market. Mahindra’s farm equipment business sold 27,595 tractors domestically in August 2026, up 5% on the year. From April to August, domestic sales ran 17% ahead at 2,12,664 units. The Swaraj brand retailed 88,826 tractors over those months against 71,701 a year earlier, lifting its retail market share to 18.84%.
Dividend Aristocracy and 68% Earnings Payout
For FY26 the company declared a dividend of Rs 110 per share, with a record date of 3rd July 2026. That continues an unbroken ladder: Rs 69 for FY21, then Rs 80, Rs 92, Rs 95, Rs 104.50 and now Rs 110.
It absorbed 68% of the year’s earnings. The five-year average payout sits at 76%. Total borrowings at the end of FY26 were Rs 1 cr against shareholder funds of Rs 489 cr. Return on capital employed was 58.7%, and return on equity 43.8%.
| FY | FY21 | FY22 | FY23 | FY24 | FY25 | FY26 | 5Y CAGR | Q1FY27 |
| Sales/Rs cr | 987 | 1,138 | 1,422 | 1,419 | 1,682 | 2,007 | 15.3% | 588 |
| EBITDA/Rs cr | 136 | 155 | 186 | 188 | 227 | 272 | 14.9% | 77 |
| Net Profit/Rs cr | 93 | 109 | 134 | 138 | 166 | 196 | 16.1% | 56 |
Source: Screener.in (Standalone)
EBITDA refers to operating profit before other income. Sales compounded at 15.3% over five years, operating profit at 14.9% and net profit at 16.1%. Unlike the first company, there is no distorted base year here. The series rises in every year except FY24, when revenue was flat.
Breaking Down Swaraj Engines’ Working Capital Surge
The company has a current dividend yield of 3.12% while the industry median is 0.5%. The company maintains a healthy payout ratio of 76%.
The one soft spot in FY26 is cash. Cash from operations fell to Rs 117 cr from Rs 177 cr the previous year, even as operating profit rose to Rs 272 cr. Cash conversion dropped from 103% of operating profit to 68%. Working capital days jumped from 9 to 32. Free cash flow fell to Rs 47 cr from Rs 152 cr.
Part of that is capital work in progress, which rose to Rs 55 cr from Rs 5 cr, pointing to capacity being added. Part is stock and receivables building ahead of the festive season. One weak year in a business with a negative cash conversion cycle is worth watching, not panicking over. Two would be a different matter.
Valuations Approaching 10x Book
The share price of Swaraj Engines was about Rs 1,635 in September 2021 and as of closing on 16th September 2026 it was Rs 3,525. That is 22% lower than its 52-week high of Rs 4,545 but closer to its 52-week low of Rs 3,300.
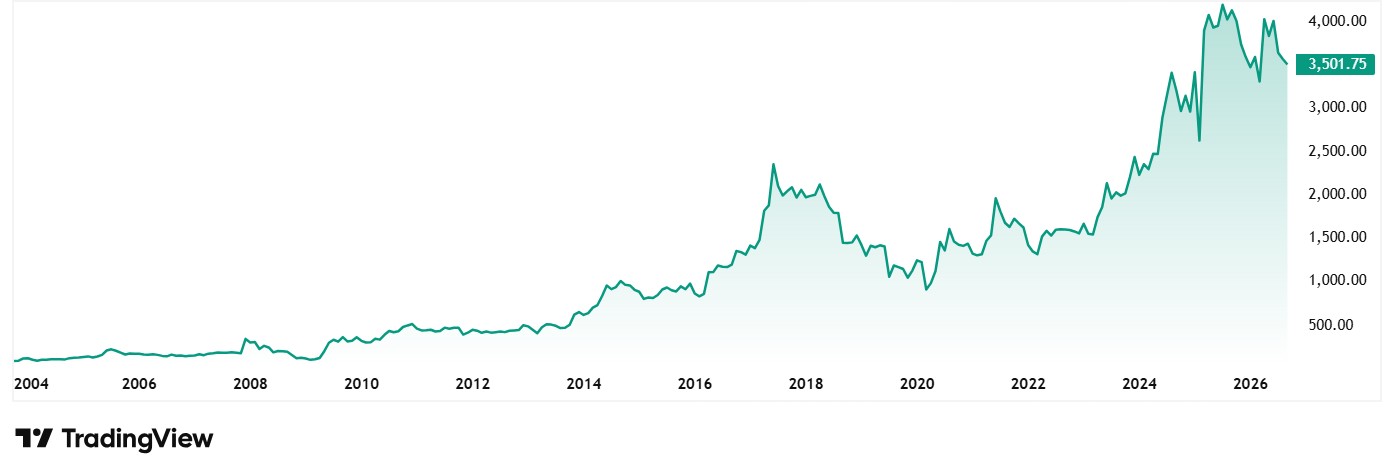
The stock trades at a PE of 21x against the industry median of 41x. The 10-year median PE for the company is 22x while the industry median for the same period is 34x.
Over five years the share price has compounded at 21% a year. Over the last twelve months it has delivered nothing at all.
Tech Mahindra Yield vs. Swaraj Engines Growth
Tech Mahindra pays out 94% of a profit stream that has compounded at 2% for five years. That is a mature business returning cash because reinvestment has not earned its keep. The yield is real, the balance sheet supports it, and the margin recovery is genuine. But shareholders have earned almost nothing from the share price over five years, and the dividend has carried the entire return. Whether that changes depends on whether the operating recovery finally reaches the bottom line.
Swaraj Engines pays out 76% of a profit stream compounding at 16%, funds its growth from what is left, and carries Rs 1 cr of debt. The trade-off is concentration. One customer, one product line, one end market that moves with the monsoon. And a valuation approaching ten times book that leaves no room for a bad kharif.
Neither of these is a screen result. One is a recovery story where the dividend pays you to wait. The other is a compounding story the market has already noticed, where the yield you get depends heavily on the day you buy. A sensible step is to add these stocks to a watchlist. Then check the payout against the profit trend each quarter, not the yield against the price.
Disclaimer
Note: We have relied on data from www.Screener.in and www.trendlyne.com throughout this article. Only in cases where the data was not available, have we used an alternate, but widely used and accepted source of information, including filings made available on the BSE website.
The purpose of this article is only to share interesting charts, data points and thought-provoking opinions. It is NOT a recommendation. If you wish to consider an investment, you are strongly advised to consult your advisor. This article is strictly for educative purposes only.
Suhel Khan has been a passionate follower of the markets for over a decade. During this period, He was an integral part of a leading Equity Research organisation based in Mumbai as the Head of Sales & Marketing. Presently, he is spending most of his time dissecting the investments and strategies of the Super Investors of India.
Disclosure: The writer and his dependents do not hold the stocks discussed in this article.
The website managers, its employee(s), and contributors/writers/authors of articles have or may have an outstanding buy or sell position or holding in the securities, options on securities or other related investments of issuers and/or companies discussed therein. The content of the articles and the interpretation of data are solely the personal views of the contributors/ writers/authors. Investors must make their own investment decisions based on their specific objectives, resources and only after consulting such independent advisors as may be necessary.