




Consumer-tech platforms Meesho and Nykaa (FSN E-Commerce Ventures) are in roughly the same market cap league, at ₹1 lakh crore each. But the two are at very different stages of the journey.
Meesho grew 48% in Q1FY27, while its losses are shrinking rapidly. Nykaa, on the other hand, is growing more slowly, but profits are rising, and margins are expanding. That makes the comparison interesting. Both have emerged as consumer-tech winners, but they are getting there through very different routes.
Meesho is playing the scale game, while Nykaa is increasingly becoming an earnings story. The question for investors is what the market is paying for today: future growth or visible profit.
Why Meesho and Nykaa Matter
During the 2021 IPO boom, many consumer-tech platforms were listed, including Zomato (Now Eternal), Paytm, and Nykaa. Back then, investors were willing to pay up for user growth, gross merchandise value (GMV), and market share, even when profits were still some distance away.
That changed as interest rates rose and easy capital dried up. Growth stocks were sharply de-rated, and investors started looking beyond the top-line growth and user numbers. The focus shifted to a more basic question: when will these businesses actually make money?
That is why Meesho and Nykaa are interesting at this stage. Both have shown that their businesses can scale. But their latest numbers show they are at different points in the journey.
#1. Meesho: Growth is Still the Weapon
Meesho’s biggest strength remains its ability to grow at a pace that is difficult to ignore. Revenue from marketplace operations rose 48% YoY to ₹3,707 crore in Q1FY27. Annual transacting users (ATUs) increased 29% to 274 million, while Net Merchandise Value (NMV) grew 34% to ₹11,614 crore.
But before we get to the numbers, it is important to understand how the company makes money.
How Meesho Makes Money
Unlike traditional e-commerce platforms, Meesho follows a largely zero-commission marketplace model. Instead, it monetises the traffic and transactions taking place on its platform.
Seller Advertising & Discovery: Advertising is the main revenue stream for Meesho. Sellers compete for sponsored product placements and greater exposure in user feeds to encourage discovery. As of Q1FY27, more than two-thirds of GMV-contributing sellers advertise on the platform, with branded sellers on Meesho Mall contributing even higher ad spends as a percentage of NMV.
Logistics and Fulfillment Services: Meesho also charges sellers for services like middle-mile and last-mile delivery and returns through its proprietary logistics arm Valmo and third-party logistics partners. The company makes a margin between the freight it charges and what it costs to fulfill those orders.
A higher NMV also helps Meesho make more money from advertising and logistics. As more orders flow through the platform, more sellers pay for visibility, and more shipments generate logistics revenue. And this is where the latest numbers become interesting.
Q1FY27 Quarterly Performance of Meesho
| Metric | Q1FY26 | Q1FY27 | YoY Change |
| Marketplace Revenue (₹ crore) | 2,505 | 3,707 | 48% |
| Contribution Margin (%) | 4.4 | 4.6 | 20 bps |
| Adjusted EBITDA Loss (₹ crore) | -148.4 | -138.9 | 6.40% |
| Loss Before Tax (₹ crore) | -240.1 | -132.8 | 44.69% |
| Annual Transacting Users (in crore) | 21.3 | 27.4 | 28.64% |
During the quarter, marketplace Adjusted Earnings Before Interest, Tax, Depreciation, Amortisation (EBITDA) loss narrowed to ₹139 crore, and contribution margin also improved to 4.6%. Contribution margin is a measure of how much money is left over from revenue after subtracting only the direct, variable costs required to fulfill a specific sale or order. As per management, they managed this improvement despite higher fuel prices and minimum wage costs. Annual transacting users (ATUs) also increased 28.6% YoY to 27.4 crore.
The model therefore has an interesting operating leverage opportunity. If NMV continues to grow, Meesho can potentially monetise a larger base of transactions through advertising and logistics without having to introduce a conventional marketplace commission.
Meesho Mall- Moving Up the Chain
Meesho Mall is a dedicated marketplace segment that focuses on bringing branded products to value-conscious consumers across India, particularly in Tier-2, Tier-3, and rural markets. It currently has more than 1,200 brands on the platform.
NMV on the platform nearly doubled, rising about 93% YoY as transacting users rose 88% during Q1FY27. The opportunity here is not just higher transaction value. Branded sellers also tend to spend more on advertising, giving Meesho another way to monetise this part of its platform.
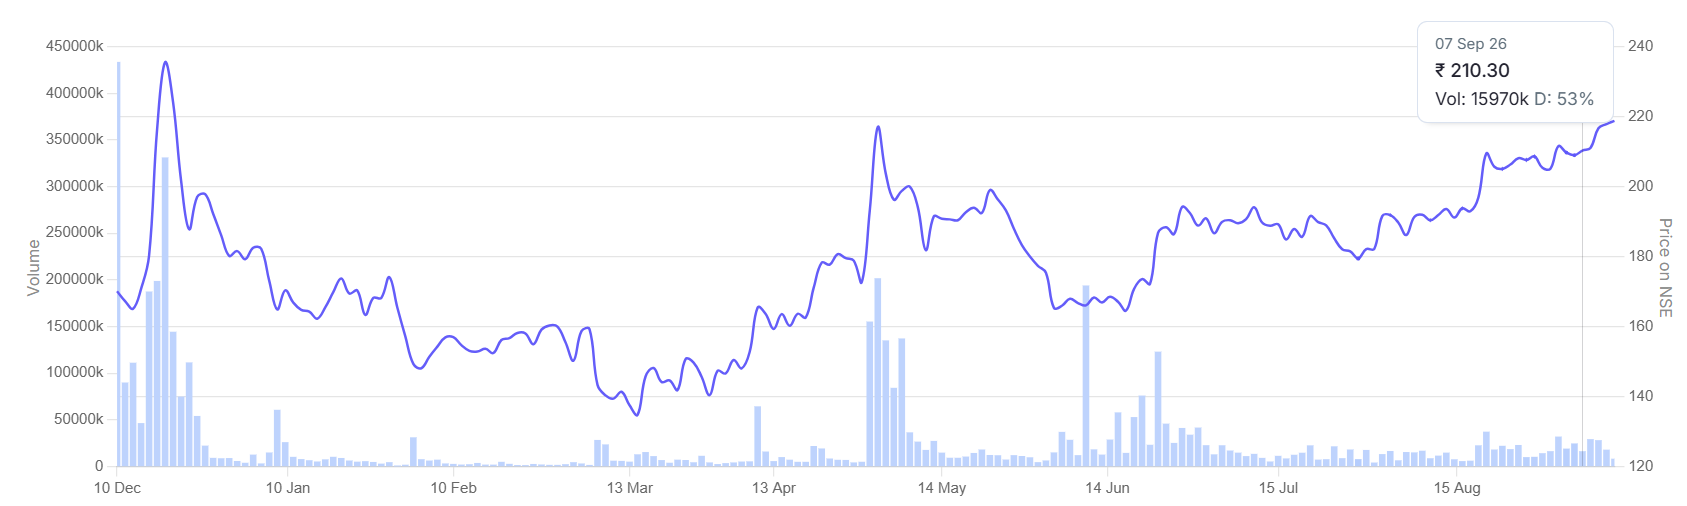
Management is targeting a long-term annualised growth of 25% for NMV over the next five years. For investors, the bigger question is whether this model can continue to deliver operating leverage at a much larger scale, and eventually turn a shrinking loss into sustainable profit. So far, the market appears to be gaining confidence in that growth-and-profitability story. The stock is up nearly 28% since its December 2025 listing.
Meesho Stock Price Chart
#2. Nykaa: The Earnings Story is Taking Shape
Nykaa’s latest numbers tell a different story from Meesho’s. Revenue is growing at a slower pace, but profits are rising much faster.
Quarterly Financial Performance
| Metric | Q1FY26 | Q1FY27 | YoY Change |
| Revenue from Operations (₹ crore) | 2,155 | 2,782 | 29.10% |
| Contribution Margin (%) | 19.90% | 21.30% | 140 bps |
| EBITDA Margin (%) | 6.50% | 8.50% | 200 bps |
| Net Profit (₹ crore) | 24 | 80 | 233.3% |
In Q1FY27, consolidated net revenue grew 29% YoY to ₹2,782 crore. Net profit, however, jumped 233% to ₹80 crore during the same period.
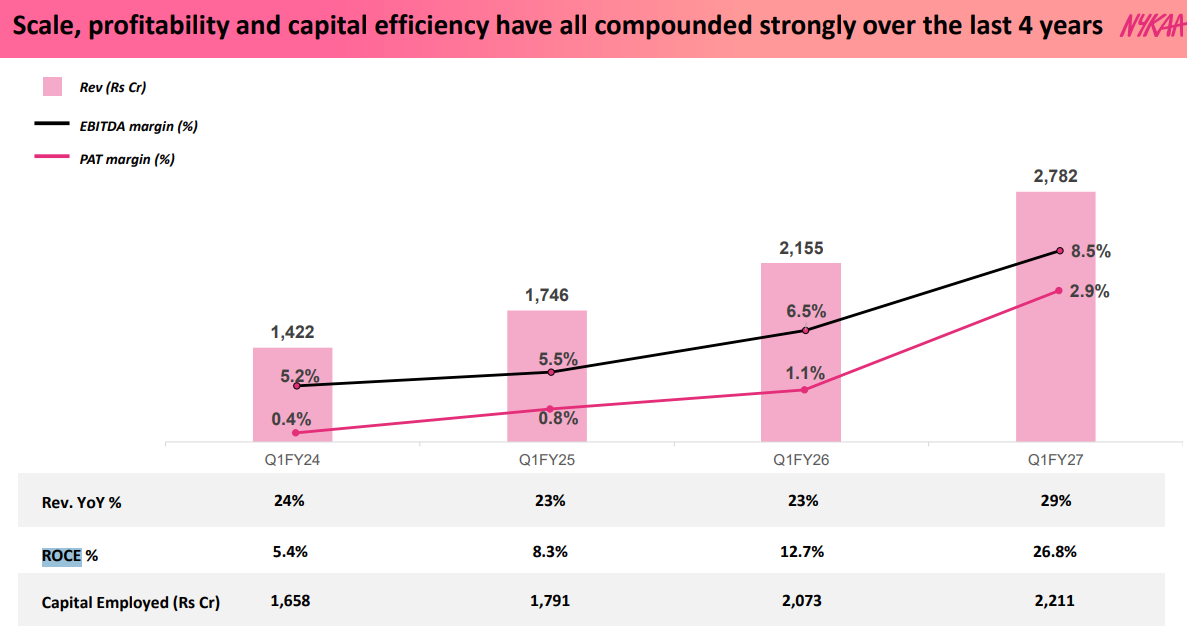
The bigger change is visible in the margins. Contribution margin expanded by 140 basis points (bps) to 21.3%, and EBITDA margin expanded by 200 bps to 8.5%, supporting the growth in profit. More importantly, this is not a one- or two-quarter improvement. Nykaa has been steadily improving its financial profile over the last several quarters, and FY26 performance is a good indication of that trend.
Annual Financial Performance
| Metric | FY25 | FY26 | YoY Change |
| Revenue from Operations (₹ crore) | 7,950 | 10,022 | 26.06% |
| Contribution Margin (%) | 19.20% | 20.20% | 100 bps |
| EBITDA Margin (%) | 6.00% | 7.50% | 150 bps |
| Net Profit (₹ crore) | 72 | 204 | 183.3% |
Premiumisation is Driving Growth
A key advantage for Nykaa is that it operates in a more premium category than value-commerce platforms such as Meesho. In Q1FY27, average order value (AOV) increased 5% YoY to ₹2,102. The segment also had 20.8 million annual unique transacting customers.
This gets particularly important because higher order values and repeat purchases can help Nykaa improve its economics as the customer base gets larger. The company is also seeing improvement in its Fashion business, which has historically been the weaker part of the group.
Nykaa Fashion’s Net Sales Value (NSV) increased 54% YoY in Q1FY27. The business turned EBITDA-positive for the first time, with a 0.1% margin. If we compare it with the previous year’s margin, there is a 627 bps improvement.
Numbers Improving Below EBITDA
Nykaa has to rely on performance marketing for customer acquisition and growth. Therefore, marketing spend becomes a significant part of the cost. In Q1FY27, Marketing and Selling & Distribution accounted for 14.8% of the revenue. However, on a year-on-year basis, this expense fell by 42 bps. For investors, this is an important metric to track as the company continues improving its profitability margins.
Improving Profitability and Returns Metrics
As it strengthens its core business, the company is investing in the next phase of growth. Nykaa is scaling its quick commerce offering, Nykaa Now, which is operational in 13 cities, along with growing its wellness business and expanding its House of Nykaa portfolio. It has also bought a 51% stake in premium derma-cosmetics brand Aminu.
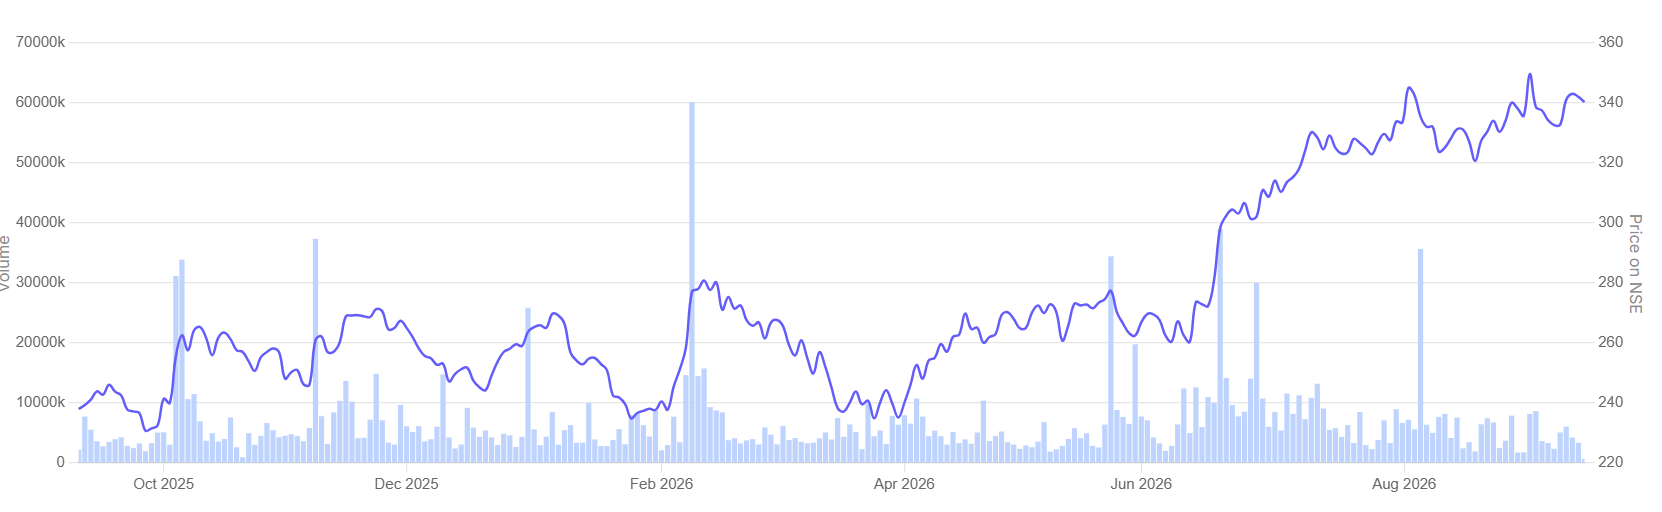
The risk, however, is that these newer businesses could require higher investments before they start contributing meaningfully to profits. Through all the initiatives, management has guided 2.5x to 3x expansion in gross merchandise value (GMV) and net revenue over FY26, alongside a 40%+ ROCE. For now, the market appears to believe the Nykaa story. Over the last year, Nykaa stock is up by around 43%.
Nykaa Stock Price Chart
Valuation: Meesho vs Nykaa
P/E is not a useful comparison here because Meesho is still loss-making, making its earnings multiple either negative or meaningless. A sales-based multiple gives a more consistent basis to compare the two companies.
Sales-based Valuation Trend
| Company | Market Cap/Sales | 5-yr Median |
| Meesho | 7.3 | – |
| Nykaa | 9.2 | 8.1 |
On a sales-based valuation, Meesho currently looks cheaper than Nykaa. Meesho trades at around 7.3x sales, compared with 9.2x for Nykaa. Nykaa is also trading above its five-year median multiple of 8.1x.
But the lower multiple does not necessarily make Meesho cheaper in valuation terms. Meesho is still loss-making, while Nykaa is already profitable and expanding margins. More importantly, Meesho’s revenue does not fully capture the scale of transactions on its platform because of its largely zero-commission model.
That makes the comparison less straightforward: Meesho is being valued more on future growth and its ability to convert that scale into profits, while Nykaa has a more visible earnings base today.
Two Winners, Two Different Paths
Meesho and Nykaa may now sit in a similar market-cap bracket, but the market is betting on two very different stories.
Meesho is still a growth story waiting to prove its profit potential. Nykaa, meanwhile, is becoming an earnings story, with margins and profits moving higher.
That difference matters more than the headline market caps. Meesho needs to show that scale can translate into sustainable profits, while Nykaa needs to prove that its improving earnings can justify the premium valuation. Both companies are winning, but investors are paying for very different things. Add these stocks to your watchlist and monitor how they execute their growth plans.
Disclaimer
Note: We have relied on data from www.Screener.in throughout this article. Only in cases where the data was not available, have we used an alternate, but widely used and accepted source of information.
The purpose of this article is only to share interesting charts, data points and thought-provoking opinions. It is NOT a recommendation. If you wish to consider an investment, you are strongly advised to consult your advisor. This article is strictly for educative purposes only.
Deepan Datta has spent over a decade studying stocks and mutual funds. His passion is to uncover interesting stories in the financial markets and share them through his writings with investors at large. He is focused on delivering clear, easy to understand and research-backed insights. Deepan began his career as a Research Associate at S&P Global, where he developed a strong foundation in financial research and data analysis.
Disclosure: The writer and his dependents do not hold the stocks discussed in this article.
The website managers, their employees (s), and contributors/writers/authors of articles have or may have an outstanding buy or sell position or holding in the securities, options on securities or other related investments of issuers and/or companies discussed therein. The content of the articles and the interpretation of data are solely the personal views of the contributors/ writers/authors. Investors must make their own investment decisions based on their specific objectives, resources and only after consulting such independent advisors as may be necessary.