



India’s tyre industry has the kind of demand backdrop investors look for. The harder question is what companies are doing with it.
An ageing commercial vehicle fleet is supporting tyre replacement demand. SUVs and EVs are driving a shift toward larger, premium tyres. Rising rural spending is supporting two-wheeler and farm equipment volumes.
Almost every major listed tyre maker is growing in double digits. But strong demand is not translating into equally strong earnings. Some companies have steadily improved margins and strengthened their balance sheets; others are only beginning to show signs of a turnaround.
To find the difference, we looked beyond the latest quarter and compared the major listed tyre makers on margin trajectory, business mix and operating efficiency, and balance sheet strength.
The filter brought three names into focus: CEAT, which has shown sustained margin improvement; Apollo Tyres, which has paired better profitability with real deleveraging; and TVS Srichakra, which is showing early turnaround signs but hasn’t yet proved it can sustain them.
#1. CEAT: Stronger Before the Cost Shock
CEAT’s Q1FY27 numbers look weak. But the more important question is whether the quarter has interrupted its margin recovery. During the quarter, consolidated revenue rose 22.4% YoY to ₹4,318 crore, but net profit collapsed 96.4% to just ₹4 crore. EBITDA margin fell to 8.6%, from 10.9% a year earlier.
But looking at those numbers in isolation risks missing what has been happening underneath the business. CEAT entered the commodity shock as rubber and crude-linked costs rose sharply after a year of genuine operational improvement. In FY26, revenue grew 18.6% to ₹15,678 crore, while EBITDA margin expanded to 13.2% from 11.3% a year earlier.
CEAT Financial Performance
| Period | FY25 | FY26 | Q1FY26 | Q1FY27 |
| Revenue (₹ crore) | 13,218 | 15,678 | 3,529 | 4,318 |
| YoY Growth (%) | – | 18.6% | – | 22.4% |
| EBITDA Margin (%) | 11.3% | 13.2% | 10.9% | 8.6% |
| Net Profit (₹ crore) | 471 | 697 | 112 | 4 |
| YoY Growth (%) | – | 47.9% | – | -96.4% |
The improvement was not simply about higher tyre prices. CEAT was also moving towards a better product mix. Its 17-inch-and-above passenger car radial business grew at a 50% CAGR between FY21 and FY26, taking CEAT from the 5th-largest player in the segment in Q1FY25 to No. 2 by Q4FY26. The company has also built a strong position in EVs, with roughly 25% market share in both four-wheeler and two-wheeler EV segments.
The Cost Shock Tests the Turnaround
CEAT experienced two separate pressures in Q1FY27. The first was industry-wide. Natural rubber prices surged, pushing CEAT’s raw material basket up 16-18% sequentially. The second was company-specific. The integration of the Camso off-highway business, which it acquired from Michelin, added upfront warehousing, distribution, and personnel costs.
CEAT is now betting on price hikes to close the cost gap. It has already raised replacement-market prices by around 7% during Q1 and had taken cumulative hikes to roughly 11% by early July, with another 4%-5% planned. OEM prices have also been increased, while export prices have risen 5-7%.
The next two or three quarters will therefore be important. If these price increases catch up with the rise in raw material costs, and Camso moves towards direct billing and lower transition costs, CEAT could recover much of the margin it lost in Q1.
That would make the June quarter look less like the end of its turnaround and more like a temporary interruption to a structural improvement story.
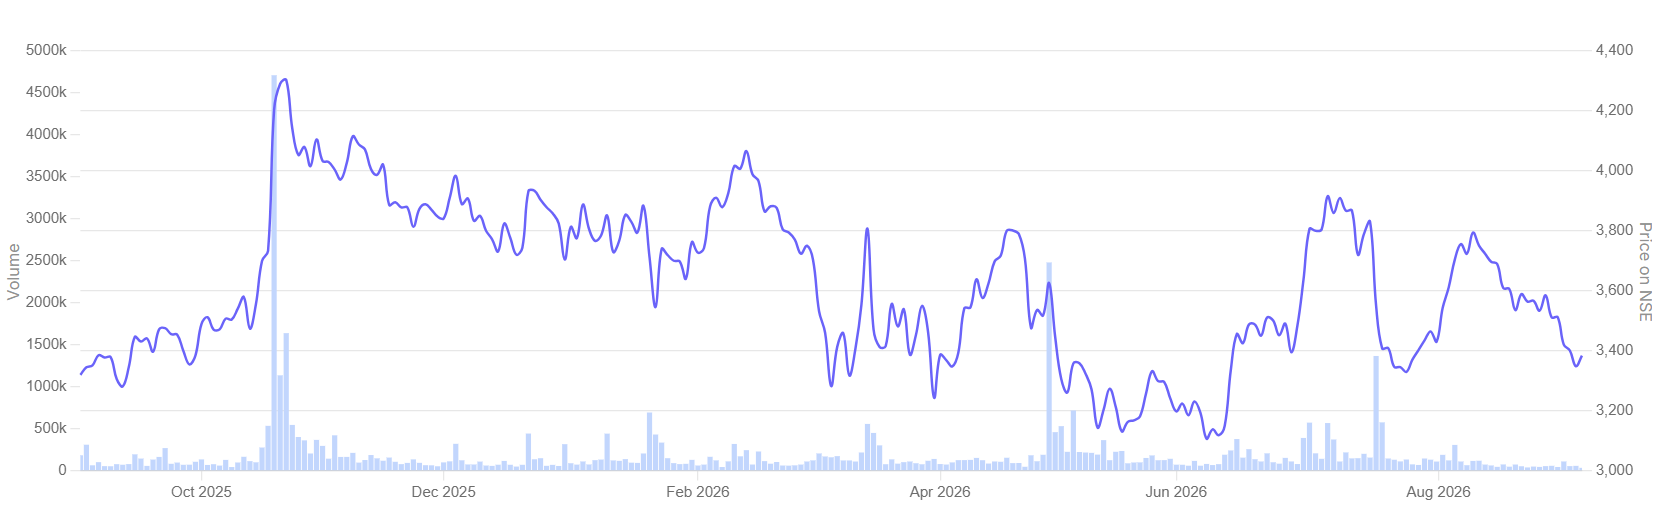
Despite the margin pressure in the recent quarter, CEAT stock price have remained steady over the last one year.
CEAT: 1 Year Stock Price Chart
#2. Apollo Tyres: The Turnaround Runs Deeper Than Margins
Apollo Tyres offers a deeper turnaround story. Its improvement is not limited to margins; the company has also materially reduced leverage.
Apollo Tyres Financial Performance
| Period | FY25 | FY26 | Q1FY26 | Q1FY27 |
| Revenue (₹ crore) | 26,123 | 28,471 | 6,561 | 7,398 |
| YoY Growth (%) | – | 9.0% | – | 12.8% |
| EBITDA Margin (%) | 13.7% | 14.6% | 13.2% | 11.7% |
| Net Profit (₹ crore) | 1,121 | 1,372 | 13* | 349 |
| YoY Growth (%) | – | 22.4% | – | 2,584.6% |
In FY26, Apollo’s consolidated EBITDA margin rose to 14.6% from 13.7% in FY25. That matters because Apollo’s profitability improvement has come alongside a significant reduction in financial leverage. But due to the cost shocks in the June quarter, EBITDA margin fell to 11.7%. Revenue, however, still grew nearly 13% YoY.
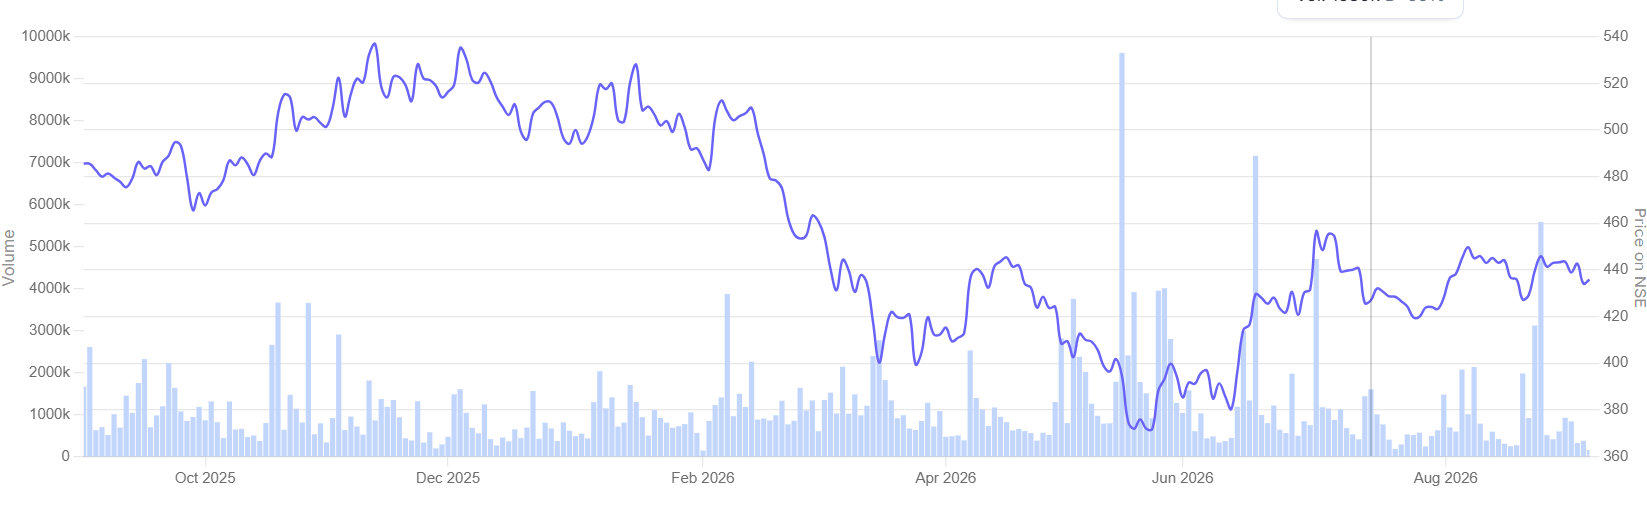
The impact of pressure on margin is visible on the Apollo Tyres share price, which has corrected nearly 11% over the last one year.
Apollo Tyres: 1 Year Stock Price Chart
The Balance Sheet Has Changed
Apollo has used the stronger operating environment in the previous years to repair its balance sheet. Consolidated net debt-to-EBITDA fell to 0.4x by March 2026 from 0.7x a year earlier, and from 3.2x in 2020.
Apollo is also trying to improve the underlying economics of its European business. It shut its high-cost Enschede plant in the Netherlands in June 2026, with production being shifted to lower-cost facilities in India and Hungary. The move should reduce the cost burden of its European business, with management expecting the benefits to become more visible in the second half of FY27.
This gives the turnaround another potential leg beyond the current demand cycle, although the benefits are still ahead rather than already visible in the numbers.
TVS Srichakra: Strong Growth, But Still Waiting for Proof
TVS Srichakra has delivered the most eye-catching growth numbers of the three. And that is precisely what makes the stock interesting and difficult to judge.
In Q1FY27, consolidated revenue rose 30.4% YoY to ₹1,068 crore, crossing the ₹1,000-crore mark for the first time. Operating margin jumped to 8% from 6% a year earlier. Net profit rose 161.5% to ₹34 crore.
The numbers clearly show a recovery. The question is whether they mark the beginning of a sustained improvement or simply a strong quarter.
TVS Srichakra Financial Performance
| Period | FY25 | FY26 | Q1FY26 | Q1FY27 |
| Revenue (₹ crore) | 3254 | 3643 | 819 | 1068 |
| YoY Growth (%) | – | 12.0% | – | 30.4% |
| Operating Margin (%) | 7.0% | 8.0% | 6.0% | 8.0% |
| Net Profit (₹ crore) | 21 | 71 | 13 | 34 |
| YoY Growth (%) | – | 238.1% | – | 161.5% |
The margin recovery also needs to be viewed in context. The 8% operating margin is still below the 10% achieved in FY24. So while recent quarters show improvement, the company has not yet returned to its earlier profitability levels. That’s why calling this a turnaround may be premature.
There are other reasons to be cautious. Its US subsidiary, Super Grip Corporation, reported an operating loss of ₹18 crore on ₹92 crore of revenue in FY26. The company is also investing ₹430 crore in capacity expansion across Uttarakhand and Madurai, even as higher raw material costs put pressure on cash generation.
However, it’s clear that TVS Srichakra is capturing demand. There’s another difference from its large peers. TVS Srichakra remains heavily exposed to the two- and three-wheeler market, with its top three customers accounting for 39.4% of revenue. That concentration makes its earnings more sensitive to the growth of the two-wheeler market.
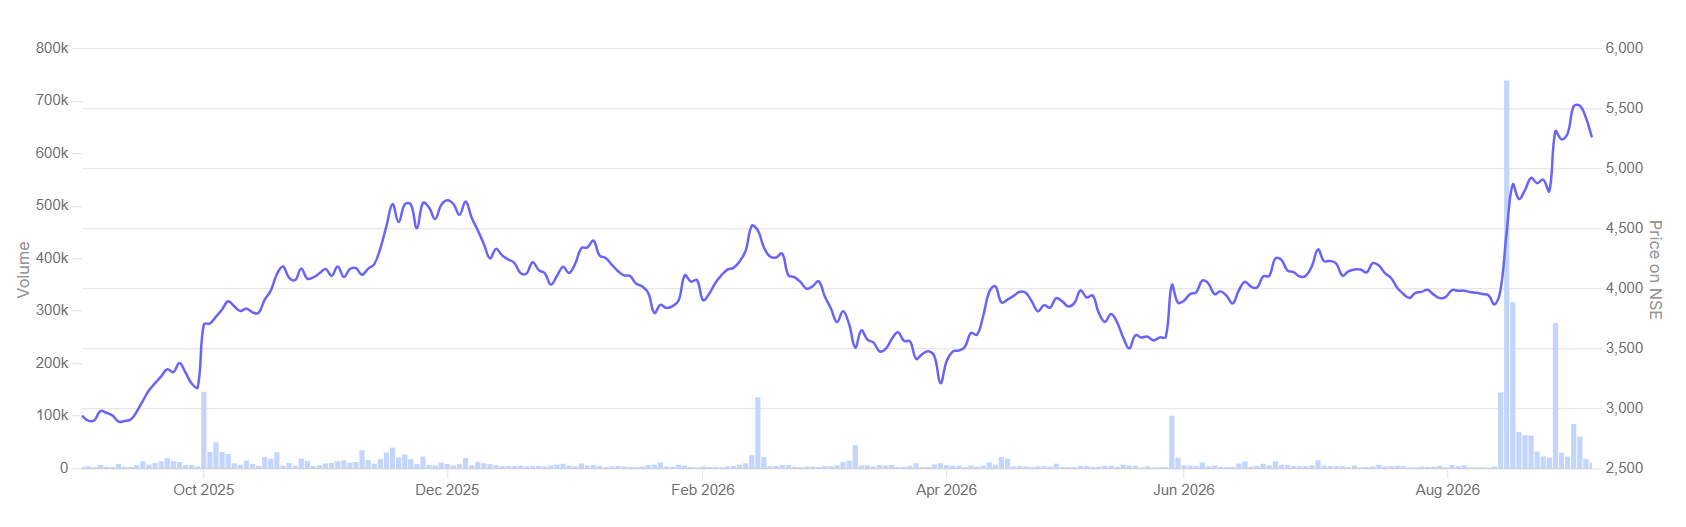
However, the market has already factored in the potential growth in TVS Srichakra stock price. It is up by nearly 80% over the last one year.
TVS Srichakra: 1 Year Stock Price Chart
For now, TVS Srichakra has proved the growth part of the thesis. It still needs to prove it can continue the improvement in margin profile.
Valuation: TVS Srichakra Is Priced for Improvement
The valuation gap between the three stocks is striking. Apollo Tyres trades at 13x trailing earnings, well below its five-year median Price-to-earnings (P/E) of 19.5x. CEAT, at 21.5x, is broadly around its historical valuation and close to the industry P/E of 22.9x.
Valuation Trend
| Metrics | Trailing P/E | 5-yr Median PE | Industry PE |
| CEAT | 21.5 | 23.0 | 22.9 |
| Apollo Tyres | 13.0 | 19.5 | |
| TVS Srichakra | 40.6 | 33.9 |
TVS Srichakra is a different story. It is being valued more like a growth/earnings-re-rating story than a conventional tyre stock. At 40.6x trailing earnings, the stock trades well above its five-year median P/E of 33.9x. The market is therefore not valuing TVS Srichakra simply on its current earnings. It is pricing in a meaningful improvement in those earnings.
But there are risks as well to this valuation. CEAT and Apollo have already demonstrated a multi-quarter improvement in their underlying economics. TVS Srichakra is still at the stage of proving that its recent rebound can become structural.
The Demand Story Is Strong. The Stocks Are Not Equal
The key takeaway is that strong tyre demand does not automatically make every tyre stock a strong investment. The bigger differentiator is what companies do with that demand. Whether they can turn higher volumes and premiumisation into durable margins, lower debt, and stronger cash generation.
CEAT and Apollo have already shown progress on both fronts, giving their turnaround stories more credibility. TVS Srichakra, meanwhile, has delivered impressive growth and early margin improvement.
The opportunity is broad, but the evidence is not. For now, CEAT and Apollo have the stronger track record, while TVS Srichakra remains a story that still needs to prove itself. Add these stocks to your watchlist and monitor how they execute their growth plans.
Disclaimer:
Note: We have relied on data from www.Screener.in throughout this article. Only in cases where the data was not available, have we used an alternate, but widely used and accepted source of information.
The purpose of this article is only to share interesting charts, data points and thought-provoking opinions. It is NOT a recommendation. If you wish to consider an investment, you are strongly advised to consult your advisor. This article is strictly for educative purposes only.
Deepan Datta has spent over a decade studying stocks and mutual funds. His passion is to uncover interesting stories in the financial markets and share them through his writings with investors at large. He is focused on delivering clear, easy to understand and research-backed insights. Deepan began his career as a Research Associate at S&P Global, where he developed a strong foundation in financial research and data analysis.
Disclosure: The writer and his dependents do not hold the stocks discussed in this article.
The website managers, their employees (s), and contributors/writers/authors of articles have or may have an outstanding buy or sell position or holding in the securities, options on securities or other related investments of issuers and/or companies discussed therein. The content of the articles and the interpretation of data are solely the personal views of the contributors/ writers/authors. Investors must make their own investment decisions based on their specific objectives, resources and only after consulting such independent advisors as may be necessary.