




Two stocks earn returns most Indian companies would envy. Both carry virtually no debt and both hand back nearly everything they make. Plus both are roughly three-quarters owned by a foreign parent. Yet the market has been selling both, and one of them has paid its shareholders nothing at all in a decade.
High ROCE vs. Reality: Why Stock Screeners Miss the Full Story
A stock screen is a blunt instrument. Ask it for high return on capital, almost no debt, a fat dividend yield and price-earnings multiple below the industry median, and it will not ask what the business actually does.
Run those filters today and two names come back from opposite corners of India’s services economy. One writes the software that tells an airline how much it really made on a ticket. The other answers phones and runs payroll for Fortune 100 companies. On a screen, they look like twins.
One of them earned a return on capital employed of 49.4% in FY26. The other managed 27.9%. Both trade well below the median of their industry groups in terms of PE. Plus, both are delivering over 4% dividend yield in flat markets. Yet the market has been selling both. One’s market value is down about 20% over the past year, and the other is about 18% down. Let us dive in.
#1 Accelya Solutions India: The Monopoly Behind Airline Revenue Accounting
Every time you fly, someone has to split the fare between the airline that sold the seat, the one that flew the leg, the agent who booked it, the tax authorities and the card network. That unglamorous arithmetic is called revenue accounting, and Accelya Solutions India Ltd has done it for over three decades. Founded in 1986 as Kale Consultants and bought by Accelya in 2010, the Indian arm delivers the software, hosting and processing for a parent group serving more than 200 airlines.
The balance sheet is close to spotless. Borrowings stood at Rs 16 cr at the end of FY26, down from Rs 62 cr a year earlier, against reserves of Rs 235 cr. In a filing to the exchanges on 15th July 2026, the company confirmed it had no outstanding long-term borrowings at all. Market capitalisation is Rs 1,687 cr.
Stagnant 10-Year Growth and Deteriorating Cash Conversion
Accelya’s financial year ends in June, so FY26 closed on 30thJune 2026.
| Financial Year | FY21 | FY22 | FY23 | FY24 | FY25 | FY26 | 5Y CAGR |
| Sales (Rs cr) | 290 | 368 | 469 | 511 | 529 | 532 | 13% |
| EBITDA (Rs cr) | 86 | 134 | 186 | 193 | 194 | 173 | 15% |
| Net Profit (Rs cr) | 42 | 76 | 127 | 94 | 129 | 95 | 18% |
EBITDA here refers to operating profit before other income.
Those growth rates look respectable. They are also badly flattered by where the counting starts. FY21 ran from July 2020 to June 2021, when the world’s airlines were grounded and Accelya’s sales fell 30%. Measuring growth from the bottom of an aviation shutdown flatters everything.
Move the starting line to FY19, the last clean pre-pandemic year. Sales then were Rs 433 cr, operating profit Rs 170 cr and net profit Rs 106 cr. Seven years on, sales are up 23%, operating profit is up 2%, and net profit is 10% lower. The ten-year record agrees: sales compounded at 5%, profit at 2%, and the share price at minus 1% a year.
FY26 was poor. Sales rose 0.7%, operating margin slipped from 37% to 33%, depreciation jumped 57% to Rs 44 cr, and net profit fell 26% to Rs 95 cr. The June 2026 quarter kept it going, with sales down 3.5% and profit down 10% year on year.
The cash statement carries the same warning. Debtor days rose from 62 to 84, working capital days from 35 to 77. Cash from operations fell to Rs 99 cr from Rs 145 cr, covering 78% of operating profit against 100% a year earlier. For a business whose whole appeal is cash conversion, that is the line to watch.
Share Price, Valuation, and Declining Dividend Payout Ratio
The share price of Accelya was about Rs 1,290 in September 2021 and as on 8th September 2026 it was Rs 1,125. The stock has corrected by 20% in the last 1 year from Rs 1,400 in September 2025 to its current price.
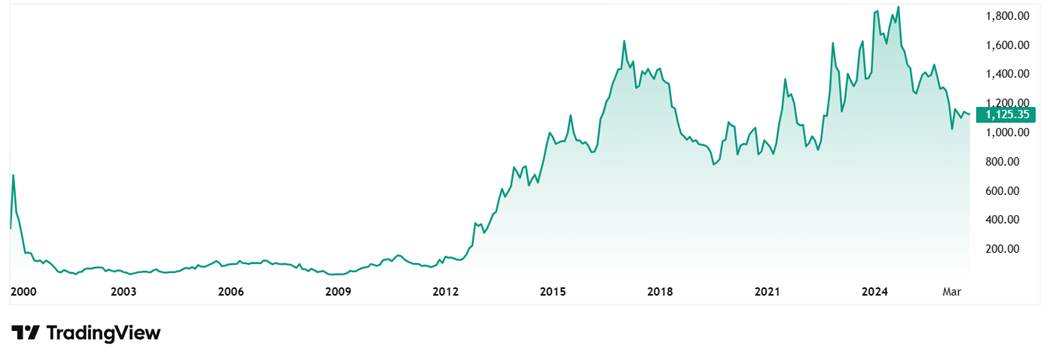
On valuation, the stock trades at a PE of about 16x which is lower than the industry median of about 19x. The 10-year median PE of the company is 20x while the industry median for the same period is 23x. Foreign institutional holding has collapsed from 2.34% in June 2025 to 0.11% a year later.
Accelya’s dividend yield sits just over 4%, respectable rather than spectacular. The direction matters more. The company paid out 121% of earnings in FY22, 103% in FY24 and 104% in FY25. In FY26 that dropped to 55%. On 29th July 2026 the board recommended a final dividend of Rs 35 a share, record date 9th October 2026, per its filing on the BSE website.
#2 Alldigi Tech: AI-Driven BPO Operations with a 7.4% Dividend Yield
Alldigi Tech was Allsec Technologies until 2024, when it renamed itself around a push into artificial intelligence. It does two things. It runs contact centres, from sites in India, the United States and the Philippines. And it processes payroll and HR compliance, where it is among India’s largest providers, serving roughly 400 clients across 42 countries. With a market capitalisation of Rs 1,225 cr, the company has delivery centers at Chennai, Bengaluru and NCR
Balance Sheet Analysis: Decoding Lease Liabilities vs. Actual Corporate Debt
The balance sheet has glaring red flags in it. Borrowings jumped from Rs 63 cr to Rs 171 cr in FY26, which on a first pass looks like a company loading up on debt while paying out its profits.
Read the next line down. Fixed assets doubled in the same year, from Rs 102 cr to Rs 208 cr. That is the signature of a long property lease, not a loan. Indian accounting rules make a company signing a multi-year lease book all its future rent at once, as an asset on one side and a liability on the other, even though no bank has lent it a rupee.
Alldigi consolidated its Bengaluru delivery centres into one new site during the year, and its FY26 filings record Rs 109.50 cr of fresh non-current lease liabilities. The rent is real. The debt is an accounting shadow.
Revenue Growth, EBITDA Margins, and International Expansion
| Financial Year | FY21 | FY22 | FY23 | FY24 | FY25 | FY26 | 5Y CAGR |
| Sales (Rs cr) | 277 | 317 | 390 | 469 | 546 | 599 | 17% |
| EBITDA (Rs cr) | 66 | 80 | 89 | 116 | 130 | 162 | 20% |
| Net Profit (Rs cr) | 35 | 36 | 49 | 64 | 83 | 82 | 19% |
Reported net profit went nowhere in FY26, slipping from Rs 83 cr to Rs 82 cr. Look closer and it improved. FY25 included Rs 28 cr of other income, largely from selling a compliance business. FY26 had barely Rs 2 cr. Strip that out and the underlying business earned meaningfully more.
Revenue grew 9.6% to Rs 599 cr while operating profit grew 25% to Rs 162 cr, as margins widened from 24% to 27% on the back of walking away from low-margin domestic contracts. International revenue is now about two-thirds of the total.
Cash from operations rose to Rs 144 cr, ahead of operating profit, and debtor days improved from 48 to 42. One caution: the FY26 tax rate was just 15%, helped by a reversal in the March quarter, and a normal rate would have made reported profit look worse.
Share Price, P/E Ratio, and the Sustainability of a 111% Dividend Payout
Alldigi paid Rs 60 a share for FY26, about Rs 91 cr in total, up a third on the year. Against a share price of Rs 804 on 8th September 2026, that is a yield of 7.4%, the highest of any listed BPO or KPO company in its industry group, and a payout ratio of 111%.
Paying out more than you earn is not permanent. It works while cash generation runs ahead of accounting profit, which it currently does, but it leaves nothing behind for a bad year.
The share price Alldigi Tech was about Rs 470 in September 2021 and as on 8th September it was Rs 804. However, in the last 1 year, the stock has corrected by 18% from Rs 980 in September 2021 to its current price.
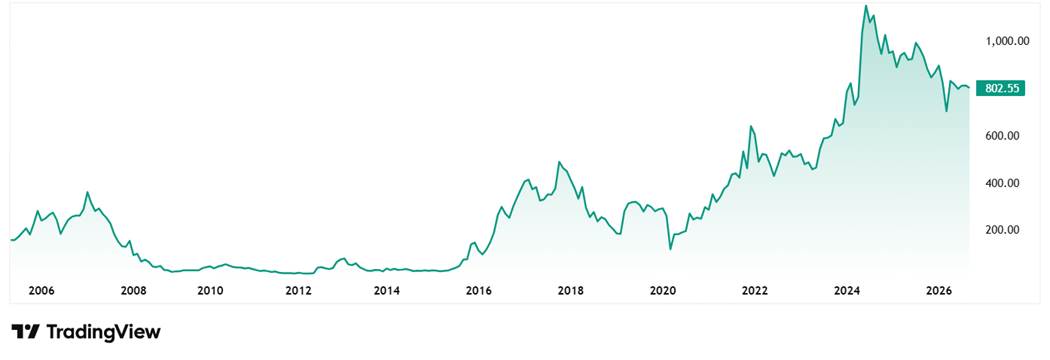
The stock trades at a PE of about 13x and the current industry median is 23x. The 10-year median PE for the company is 16x which is same as the industry median for the same period. Unlike Accelya, the long record here shows real compounding: sales and profit have both grown about 10% a year over a decade, and the share price 12% a year. Management has guided to mid-teens revenue growth in FY27.
The Foreign Promoter Dividend Trap: The Secret Behind the Big Payouts
Accelya Solutions India is 74.66% owned by Accelya Holding World S.L.U. of Barcelona, which sits inside the permanent capital fund of American private equity firm Vista Equity Partners. Alldigi Tech is 73.39% owned by Digitide Solutions, the technology arm demerged out of Quess Corp in June 2025 and backed by Canada’s Fairfax. Both float about a quarter of their shares. Institutions own 0.12% of Accelya and 2.61% of Alldigi. Almost nobody is watching.
That structure produces the dividend. A parent owning three-quarters of a cash-generating Indian subsidiary, and not needing it to reinvest, will pull the cash out. The only lawful way is a dividend paid equally to everyone. Retail holders get the same rupees per share as Barcelona does. The yield is not generosity. It is plumbing.
It also explains the cheap multiple. A business earning 49% on its capital that pays out nearly all of it is saying something plainly: it cannot find anywhere to put the money at those returns. High returns without growth make a cash cow, not a compounder, and the market prices the two differently.
Both also sit in the same line of fire. Airline revenue accounting and payroll processing are rules-based, repeatable back-office work, which is exactly what generative software is meant to swallow.
Value Traps or Big Opportunities?
Put the pair side by side and the screen ranks Accelya first: higher return on capital, higher return on equity, a lower payout, a cleaner borrowings line.
The cash flow statement ranks them the other way round. Accelya’s conversion is deteriorating, its receivables are stretching, and its shareholders have earned nothing in ten years despite a return on capital most companies will never see. Alldigi’s conversion is improving, its margins widening, its debt a landlord rather than a bank, and it has actually compounded.
That is the lesson. A screen measures a company at one instant. It cannot tell you whether a 49% return on capital is a fortress or a business that has stopped needing to invest because it has stopped growing. Only the decade-long record can, and these two point in opposite directions. A good idea would be however to add these stocks to a watchlist and keep a vigilant eye on them.
Disclaimer
Note: We have relied on data from http://www.Screener.in and http://www.trendlyne.com throughout this article. Only in cases where the data was not available, have we used an alternate, but widely used and accepted source of information.
The purpose of this article is only to share interesting charts, data points and thought-provoking opinions. It is NOT a recommendation. If you wish to consider an investment, you are strongly advised to consult your advisor. This article is strictly for educative purposes only.
Suhel Khan has been a passionate follower of the markets for over a decade. During this period, he was an integral part of a leading Equity Research organisation based in Mumbai as the Head of Sales & Marketing. Presently, he is spending most of his time dissecting the investments and strategies of the Super Investors of India.
Disclosure: The writer and his dependents do not hold the stocks discussed in this article. The website managers, its employee(s), and contributors/writers/authors of articles have or may have an outstanding buy or sell position or holding in the securities, options on securities or other related investments of issuers and/or companies discussed therein. The content of the articles and the interpretation of data are solely the personal views of the contributors/writers/authors. Investors must make their own investment decisions based on their specific objectives, resources and only after consulting such independent advisors as may be necessary.