




Our recent SME series examined smaller businesses linked to India’s infrastructure expansion and the railway supply chain. We now turn to another part of the investment cycle: ships, ports and marine components.
India’s maritime expansion brings together several industries. Ships require engineering and components. Ports need cargo handling and transport services. The government’s maritime expansion plans target more than 700 million tonnes of additional annual port capacity by 2030, alongside measures to strengthen domestic shipbuilding. This could create opportunities for smaller businesses serving different parts of this network.
However, participation in a growing industry does not guarantee financial strength. SME stocks also carry liquidity and business risks. We therefore applied our quality screen before examining companies with maritime exposure.
SME Shipyard Stocks: The 15% ROCE Quality Screen
The screen required SME companies with a market capitalisation above Rs 100 crore. Return on capital employed (ROCE) had to exceed 15%, both currently and on a three-year average. Debt-to-equity needed to remain below 0.5, with positive operating cash flow in the latest financial year.
Three-year annualised sales and profit growth each had to exceed 10%. Operating profit margins also needed to be above 10%, while debtor days had to remain below 150.
Ownership checks required promoter holdings above 30%, with no decline over the period measured by the screen and no pledged shares. Companies also needed more than 100 shareholders.
A third company, Captain Technocast, was also considered for its marine castings. However, these sit within a diversified casting business, making it a less direct fit for this maritime shortlist. We have therefore left it out. We also recently covered the company in our article on precision SMEs supplying defence components.
Within this framework, we examine two businesses with distinct maritime links. Let’s look at their businesses, financial performance and the extent of their connection to India’s maritime expansion.
#1 Laxmipati Engineering Works: Shipbuilding, Defence Exposure, And Growth Metrics
Incorporated in 2012, Laxmipati Engineering Works is engaged in shipbuilding, ship repair, fabrication, heavy engineering, engineering infrastructure services, shutdown maintenance projects and precision machining.
Laxmipati Engineering: Order Books, Defence Output, and Margin Impact
Laxmipati Engineering Works has a three-year sales compounded annual growth rate (CAGR) of 68% and ROCE of 21.8%, according to Screener. Both exceed the screening thresholds. Screener also displays 22% three-year profit growth. However, FY23 losses make this unsuitable as a conventional profit CAGR.
Its maritime exposure includes shipbuilding, repairs and fabrication. The FY26 annual report records fabrication work for Mazagon Dock Shipbuilders and a licence to manufacture warships. The business remains diversified. Steel projects generated 53% of revenue, while shipping revenue was not separately disclosed.
The company’s expansion roadmap as outlined in annual report includes three workshops covering 6,000 square metres. It also plans investments in automation and research. No commissioning date is specified. A manufacturing facility has been established to serve export orders for Zeeco India in oil, gas and energy.
Why Laxmipati’s 316% Profit Surge Requires Context
The annual report shows FY26 revenue rising 43.7% year-on-year (YoY) to Rs 72 crore. Net profit increased 316% to Rs 27 crore, including a Rs 23.7 crore asset-sale gain. Before exceptional items, profit before tax rose 95.2% to Rs 9.1 crore. Screener places operating margins at approximately 18%, against 20% in FY25.
The balance sheet and cash flow statement show borrowings falling from Rs 45.1 crore to Rs 16.6 crore. Debt-to-equity consequently stood at 0.47, below the screen’s 0.5 ceiling. Operating cash flow was positive at Rs 5.2 crore. Debtor days increased from 73 to 80, remaining within the 150-day limit.
Shareholding data show promoter ownership unchanged at 73.45% between March 2025 and March 2026. Shareholder numbers increased from 98 to 168, clearing the screen’s minimum requirement.
Growth will depend on fresh orders, workshop utilisation and collections. Historical sales growth should not be extrapolated, while exceptional income complicates profit comparisons. Investors must also consider SME liquidity risks. The company’s half-yearly reporting leaves longer gaps between financial updates.
Laxmipati Engineering Works Financial Performance
| Metric | FY26 |
| Revenue | Rs 72 crore |
| Revenue growth | 43.7% YoY |
| Net profit | Rs 27 crore* |
| Profit growth | 316% YoY |
*FY26 profit was boosted by an exceptional pre-tax gain of Rs 23.68 crore on asset sales.
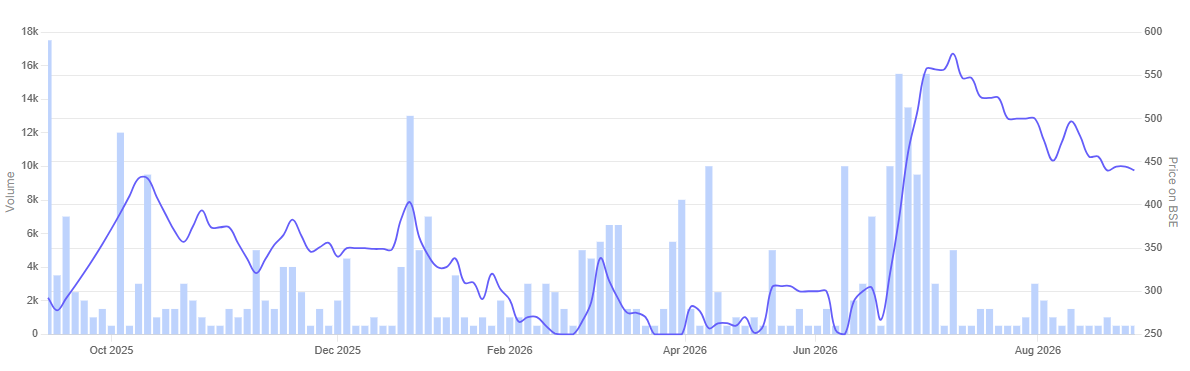
In the past year, the share price of Laxmipati Engineering Works rallied 50.4%.
Laxmipati Engineering Works 1-year Share Price Chart
#2 Paradeep Parivahan: Anchoring a 67% Profit CAGR to Sagarmala Contracts
Paradeep Parivahan is a premier logistics and cargo handling company specializing in port operations, intra-port transportation, and bulk material handling. Based within Paradip Port, the company provides end-to-end logistics solutions, including railway siding operations, stevedoring, warehousing, and multimodal transport.
Paradeep Parivahan clears the growth filters with standalone three-year sales and profit CAGRs of 24% and 67%, respectively, according to Screener. ROCE of 22.2% also exceeds the screen’s 15% threshold.
Beyond Cargo: Breakwater Construction and Fleet Electrification
Its maritime exposure comes through port and cargo logistics. The FY26 investor presentation outlines bulk cargo handling, intra-port transportation and railway siding operations around Paradip Port. Transportation and loading or unloading together generated 74% of consolidated revenue.
The company’s growth roadmap centres on fleet expansion, heavy equipment and electric trucks. Management expects Paradip Port’s capacity expansion to support handling demand. It also reports launching an electric truck fleet under a multi-year agreement with UltraTech Cement. Four acquired subsidiaries add opportunities to broaden services. The presentation does not specify a fleet expansion budget or deployment schedule.
Paradeep Parivahan has already secured maritime construction work. In its November 2025 earnings call, management reported boulder transportation and reclamation work for a breakwater at Paradip alongside L&T. It also cited new government and fishing-harbour contracts.
Management linked this expansion to the government’s maritime infrastructure push, including Sagarmala, port modernisation and multimodal logistics. These orders extend its activities beyond cargo movement into construction support. The call did not quantify revenue attributable specifically to Sagarmala.
Tracking FY26 Cash Flows and the DII Ownership Decline
The investor presentation also shows FY26 revenue increasing 15% YoY to Rs 386.3 crore. Net profit rose 27.4% to Rs 30.8 crore. Both growth rates were below their three-year CAGRs. Screener places operating margins at approximately 13%.
The financial statements report positive operating cash flow of Rs 17.9 crore. Audited debt-to-equity stood at 0.42, below the 0.5 ceiling. Debtor days were 82, within the screen’s 150-day limit.
Shareholding data show promoter ownership unchanged at 65.96% between March 2025 and March 2026. The company had 807 shareholders. Domestic institutional ownership, however, declined from 9.06% to 2.3% over that period.
Further growth depends on cargo volumes, equipment utilisation and timely collections. Past sales and profit CAGRs should not be treated as forecasts. Investors must also consider liquidity risks in SME stocks.
Paradeep Parivahan Financial Performance
| Metric | FY26 |
| Revenue | Rs 386.3 crore |
| Revenue growth | 15% YoY |
| Net profit | Rs 30.8 crore |
| Profit growth | 27.4% YoY |
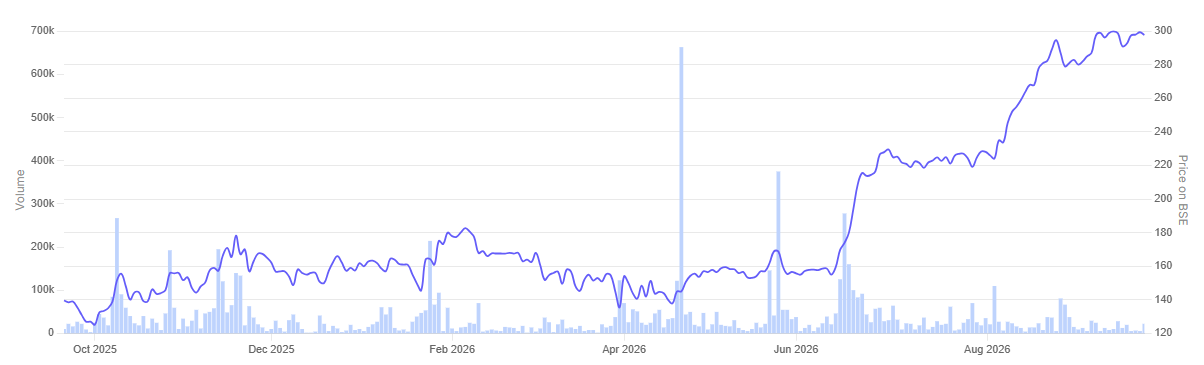
In the past year, the share price of Paradeep Parivahan surged 115.7%.
Paradeep Parivahan 1-year Share Price Chart
Conclusion
India’s maritime expansion creates opportunities across engineering, cargo handling and component supply. These three companies extend the theme explored in our earlier coverage of railway SMEs and infrastructure-linked businesses. The key question is how much of that opportunity each business can convert into sustainable earnings.
The screening ratios provide a starting point. Further assessment needs to establish the scale of maritime revenue, the strength of repeat orders and the cash required for expansion. Order execution, equipment utilisation and collections will matter. Past sales and profit growth should also be read carefully where small starting bases or exceptional gains influence the comparison.
Valuations remain equally relevant. A growing business can still offer limited upside if its share price already assumes strong execution. SME trading lots and thin liquidity can make exits difficult. Half-yearly reporting also leaves longer gaps between financial updates. These companies form a shortlist for further research. Their inclusion does not constitute an investment recommendation.
Two SMEs Linked to Maritime Expansion: Growth and Operating Performance
| Metric | Laxmipati Engineering Works | Paradeep Parivahan |
| Three-year sales CAGR | 68% | 24% |
| Three-year profit CAGR | Not meaningful* | 67% |
| FY26 operating margin | 18% | 13% |
| FY26 debtor days | 80 | 82 |
| FY26 operating cash flow (Rs crore) | 5.20 | 17.90 |
Both companies’ figures are standalone. Screener displays three-year profit growth of 22% for Laxmipati. However, its FY23 loss prevents a meaningful conventional CAGR calculation. Its FY26 profit also benefited from an exceptional pre-tax asset-sale gain of ₹23.68 crore.
You can track how these are progressing by adding stocks to your watchlist.
Disclaimer:
Note: We have relied on data from www.Screener.in throughout this article. Only in cases where the data was not available, have we used an alternate, but widely used and accepted source of information.
The purpose of this article is only to share interesting charts, data points and thought-provoking opinions. It is NOT a recommendation. If you wish to consider an investment, you are strongly advised to consult your advisor. This article is strictly for educative purposes only.
Ekta Sonecha Desai has a passion for writing and a deep interest in the equity markets. Combined with an analytical approach, she likes to deep dive into the world of companies, studying their performance, and uncovering insights that bring value to her readers.
Disclosure: The writer and her dependents do not hold the stocks discussed in this article.
The website managers, its employee(s), and contributors/writers/authors of articles have or may have an outstanding buy or sell position or holding in the securities, options on securities or other related investments of issuers and/or companies discussed therein. The content of the articles and the interpretation of data are solely the personal views of the contributors/ writers/authors. Investors must make their own investment decisions based on their specific objectives, resources and only after consulting such independent advisors as may be necessary.