




Gold’s Record Run and the Jewellery Stock Rush
Indians have always bought gold for weddings, festivals and a rainy day. What has changed in 2026 is the price. 24-carat gold now costs well above Rs 1.5 lakh for 10 grams, and on 13th May 2026, the import duty on gold went up from 6% to 15%. That hurts shoppers. For listed jewellers sitting on large piles of stock, it has been a different story.
Two of them stand out. One is a 162-year-old Mumbai name that has just agreed to sell control to a Chennai rival. The other is a Madurai chain that rules the small towns of Tamil Nadu. Both stocks have multiplied roughly eight to nine and a half times in five years. That’s way more than Titan, one of the bigger wealth creators in India. Over the last 5 years, Titan is up “only” a little over two times. Both the regional jewellers have posted triple-digit growth in net profit over the trailing twelve months. Titan on the other hand recorded a profit growth of 57%.
But the market is reading them in very different ways. One has hit the upper circuit day after day since a takeover deal was announced. The other fell about 19% in two sessions after its June quarter results, despite an 86% jump in profit. So, which signal deserves your attention? Let us dive in.
#1 TBZ: TBZ Takeover Valuations & Open Offer Disconnect
Incorporated in 2007, Tribhovandas Bhimji Zaveri, better known as TBZ, traces its roots to a single shop in Mumbai’s Zaveri Bazaar in 1864. The fifth generation of the family runs it today. It sells gold, diamond, jadau and platinum jewellery through 37 stores in 28 cities, mostly in Maharashtra and Gujarat. Roughly 65% of its revenue comes from wedding and occasion buying.
With a market cap of Rs 4,445 cr, TBZ is now a company in the middle of a change of control. On 31st August 2026, GRT Jewellers of Chennai signed an agreement to buy the promoters’ entire 74.12% stake, or 4,94,59,775 shares, for up to Rs 1,033.71 cr. At the top end, that works out to about Rs 209 a share.
GRT has also made the mandatory open offer for another 25.88% at Rs 249.61 a share. This is per the draft letter of offer TBZ filed with BSE on 16th September 2026.
The Rs 249 Open Offer That Few Will Use
Here is the odd part. TBZ closed at about Rs 305 on the day the deal was signed. It has hit the upper circuit repeatedly since, and as of closing on 22nd September 2026 it stood at Rs 665. That is roughly 2.7 times the open offer price and about 3 times what the family is set to receive. At these levels, few public shareholders have any reason to tender.
Put another way, GRT is buying control at roughly 6.5 times TBZ’s trailing twelve-month profit of Rs 214 cr. The market now values the same company at close to 20 times. Buyers seem to be betting on what GRT, which runs 68 stores in India and one in Singapore, can build with the TBZ name. ICRA has placed the company’s ratings on watch with positive implications after the deal, as per a BSE filing dated 11th September 2026.
High Margins vs. Low Cash Flow
| Financial Year | FY21 | FY22 | FY23 | FY24 | FY25 | FY26 | 5Y CAGR |
| Sales (Rs cr) | 1,342 | 1,844 | 2,394 | 2,299 | 2,620 | 3,203 | 19% |
| EBITDA (Rs cr) | 126 | 82 | 124 | 146 | 181 | 369 | 24% |
| Net Profit (Rs cr) | 43 | 20 | 40 | 54 | 68 | 202 | 36% |
Source: Screener.in (Consolidated)
EBITDA here refers to operating profit before other income. Sales grew at about 19% a year over five years, EBITDA at 24% and net profit at 36%. A word of caution, though. FY21 was a Covid-hit year, when sales fell to Rs 1,342 cr from Rs 1,810 cr, and that low base flatters the growth rate.
The real story is FY26. Net profit nearly tripled to Rs 202 cr from Rs 68 cr, as the operating margin rose to 12% from 7%. For the twelve months to June 2026, net profit stood at Rs 214 cr, up about 189%, on sales of Rs 3,420 cr. In the June 2026 quarter alone, sales rose about 35% year-on-year to Rs 841 cr and profit rose about 51% to Rs 34 cr.
Profits That Are Not Turning into Cash
This is where a careful reading matters. When gold rises, a jeweller selling stock bought months earlier at lower prices sees its margins swell. That gain can reverse when gold falls. And TBZ’s cash has not kept pace with its profit. FY26 cash from operations was just Rs 30 cr against a net profit of Rs 202 cr.
Inventory days stood at 249, which means gold sits on its shelves for about eight months on average. Borrowings climbed to Rs 886 cr in March 2026, a little more than the company’s entire net worth of Rs 838 cr.
TBZ Share Price and Valuation Check
The share price of TBZ was about Rs 75 in September 2021 and as of closing on 22nd September 2026 it was Rs 665, which is a 787% jump in 5 years. Simply put, Rs 1 lakh invested five years ago would be worth about Rs 8.87 lakh today. Over just the past year, the stock is up about 235%.
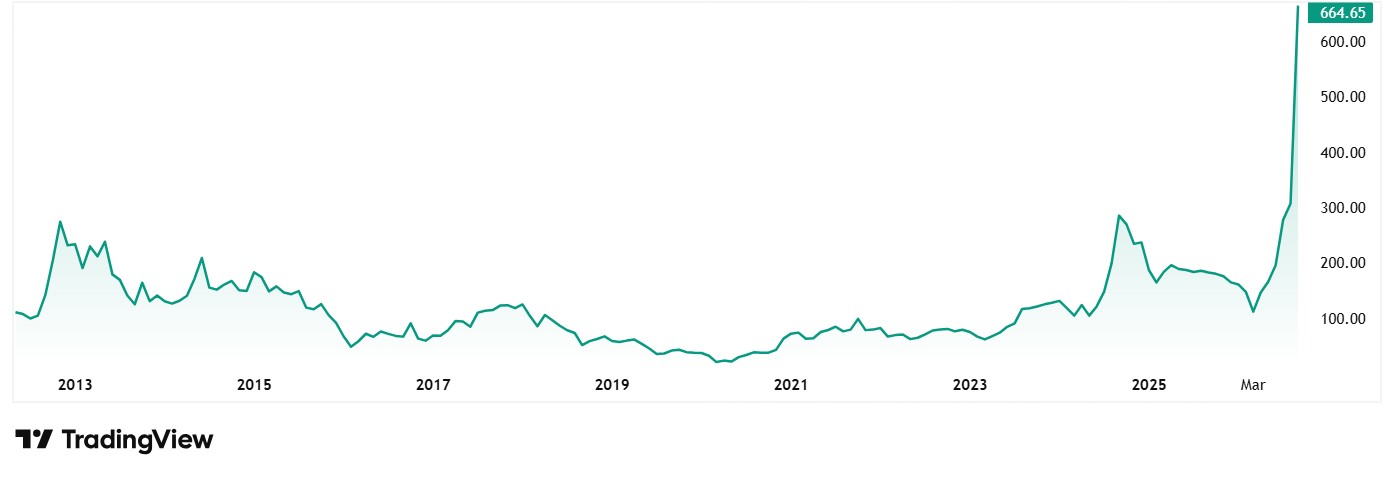
About valuations, the stock currently trades at a PE of about 21x compared to the current industry median of 19x. The 10-year median PE for the company is 16x while the industry median for the same period is 19x.
Return on equity for FY26 was about 27%, against a ten-year average of just 9%. That gap says FY26 was exceptional, not typical. Foreign investors held 1.47% in June 2026, up from nil in September 2025, while domestic institutions hold nothing at all.
#2 Thangamayil Jewellery: Price-Driven Revenue Growth
Incorporated in 2000 in Madurai, Thangamayil Jewellery runs a chain of stores across Tamil Nadu, a state the company says accounts for about 40% of India’s gold consumption.
With a market cap of Rs 15,915 cr, it is over three times TBZ’s size. It opened two more stores in Chennai on 23rd August 2026, taking its count past 66, as per its BSE filing.
The 264% Jump in Trailing Profit
Thangamayil’s net profit for the twelve months to June 2026 stands at Rs 391 cr, up about 264% from the previous twelve months. Sales over the same period reached Rs 9,622 cr.
| Financial Year | FY21 | FY22 | FY23 | FY24 | FY25 | FY26 | 5Y CAGR |
| Sales (Rs cr) | 1,819 | 2,193 | 3,153 | 3,827 | 4,911 | 8,499 | 36% |
| EBITDA (Rs cr) | 147 | 86 | 153 | 212 | 219 | 565 | 31% |
| Net Profit (Rs cr) | 87 | 39 | 80 | 123 | 119 | 352 | 32% |
Source: Screener.in (Standalone)
EBITDA here refers to operating profit before other income. Over five years, sales grew about 36% a year, EBITDA about 31% and net profit about 32%. FY26 was the breakout year. Sales jumped 73% to Rs 8,499 cr, and profit nearly tripled to Rs 352 cr.
How Much of This Is Just the Gold Price?
Look under the hood, though, and most of the growth is price, not volume. In the June 2026 quarter, revenue rose 71% year-on-year to Rs 2,666 cr and profit rose 86% to Rs 85 cr. But gold ornament volumes grew just 9%, to 1,620 kg, according to the company’s results disclosure. The rest came from a much higher price per gram.
The duty story cuts both ways, and Thangamayil has seen both sides. When the Union Budget cut the import duty on gold in July 2024, the company lost about Rs 15.5 cr selling stock on which it had paid the higher duty. It slipped to a net loss of Rs 17 cr in the September 2024 quarter. A higher duty lifts the value of stock already on the shelves. But it also makes shoppers pause.
Why the Stock Fell 19% in Two Days
That pause is what spooked the market in late July. With its June quarter results, management said gold volumes had softened because of the duty hike and a weaker rupee. The West Asia conflict also slowed purchases funded by expatriate remittances. It added that sales showed no visible improvement in the first 28 days of the September quarter. It expects the deferred demand to return in the second half of FY27. The stock hit the lower circuit on two straight days, falling about 19%.
Early signs since then look better. The company told the exchanges that sales during the three-day Aadi Perukku festival in early August 2026 more than doubled to about Rs 344 cr from Rs 157 cr.
Thangamayil Share Price and Valuation Check
The share price of Thangamayil Jewellery was about Rs 520 in September 2021 and as of closing on 22nd September 2026 it was Rs 5,120, which is a jump of 885% in 5 years. Rs 1 lakh invested five years ago would be worth roughly Rs 9.85 lakhs today.
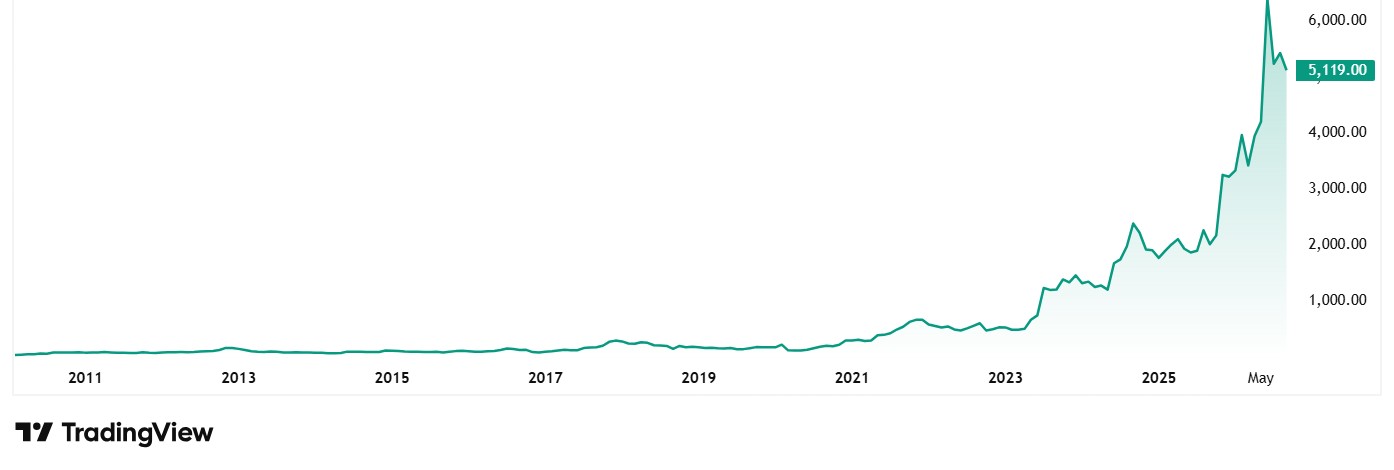
However, at the current price, the stock is trading 31% below its 52-week high of Rs 7,430.
Looking at the valuations, the stock trades at a PE of about 41x compared to the current industry median of 19x. The 10-year median PE for the company is 10x while the industry median for the same period is 19x.
The balance sheet looks steadier than TBZ’s. Borrowings stood at Rs 913 cr in March 2026 against a net worth of Rs 1,416 cr. Cash from operations in FY26 was Rs 322 cr, close to its profit of Rs 352 cr. FY25, however, saw an operating cash outflow of Rs 424 cr.
Return on capital employed is about 25% and return on equity about 28%. Domestic institutions have raised their holding to 16.43% in June 2026 from 11.51% in March 2024, while foreign investors hold 5.54%. Promoters hold 61.61%.
Gold Stocks at a Crossroads: A Deal Premium and a Gold Premium
Both stocks we analysed today are riding the same wave, a record gold price that lifts the value of every gram on the shelf. Both have seen profits jump by triple digits. But the market is pricing them for very different reasons.
TBZ’s price now rests largely on hope about its new owner. The public is paying about three times what GRT agreed to pay the family. And the business turned only Rs 30 cr of its Rs 202 cr profit into operating cash last year. Thangamayil’s price rests on volumes, and those have been soft. Its growth is real, but gold is doing much of the heavy lifting.
For anyone looking at gold stocks in 2026, the real question is not whether gold stays high. It is what these businesses earn when gold stops rising. The answer lies in volumes, cash flow and, for TBZ, what GRT does next. A good idea would be to add these stocks to a watchlist and keep an eye on them.
Disclaimer
Note: We have relied on data from www.Screener.in and www.trendlyne.com throughout this article. Only in cases where the data was not available, have we used an alternate, but widely used and accepted source of information, including filings made available on the BSE website.
The purpose of this article is only to share interesting charts, data points and thought-provoking opinions. It is NOT a recommendation. If you wish to consider an investment, you are strongly advised to consult your advisor. This article is strictly for educative purposes only.
Suhel Khan has been a passionate follower of the markets for over a decade. During this period, He was an integral part of a leading Equity Research organisation based in Mumbai as the Head of Sales & Marketing. Presently, he is spending most of his time dissecting the investments and strategies of the Super Investors of India.
Disclosure: The writer and his dependents do not hold the stocks discussed in this article.
The website managers, its employee(s), and contributors/writers/authors of articles have or may have an outstanding buy or sell position or holding in the securities, options on securities or other related investments of issuers and/or companies discussed therein. The content of the articles and the interpretation of data are solely the personal views of the contributors/ writers/authors.