




Welcome to the latest edition of Dividend Hunter. In recent weeks, we have analysed companies where strong cash flows could translate into consistent dividends. In our previous edition, we covered one of India’s leading Public Sector Undertaking NBFCs offering a 3.6% dividend yield.
This week, in our Dividend Hunter series, we discuss the first commercial bank established in 1911, owned and managed by Indians. The bank features 4,606 branches, with 65.2% of the network positioned in rural and semi-urban regions. The bank serves an active customer base of 8.3 crore.
Over the past five years, the bank’s revenue grew at a CAGR of 10%. However, net profit grew even faster, with a CAGR of 46%. In FY25, the bank resumed dividend payments after nearly a decade, starting with a dividend of ₹0.19 per share and later increasing it by 6.3X to ₹1.2 per share in FY26.
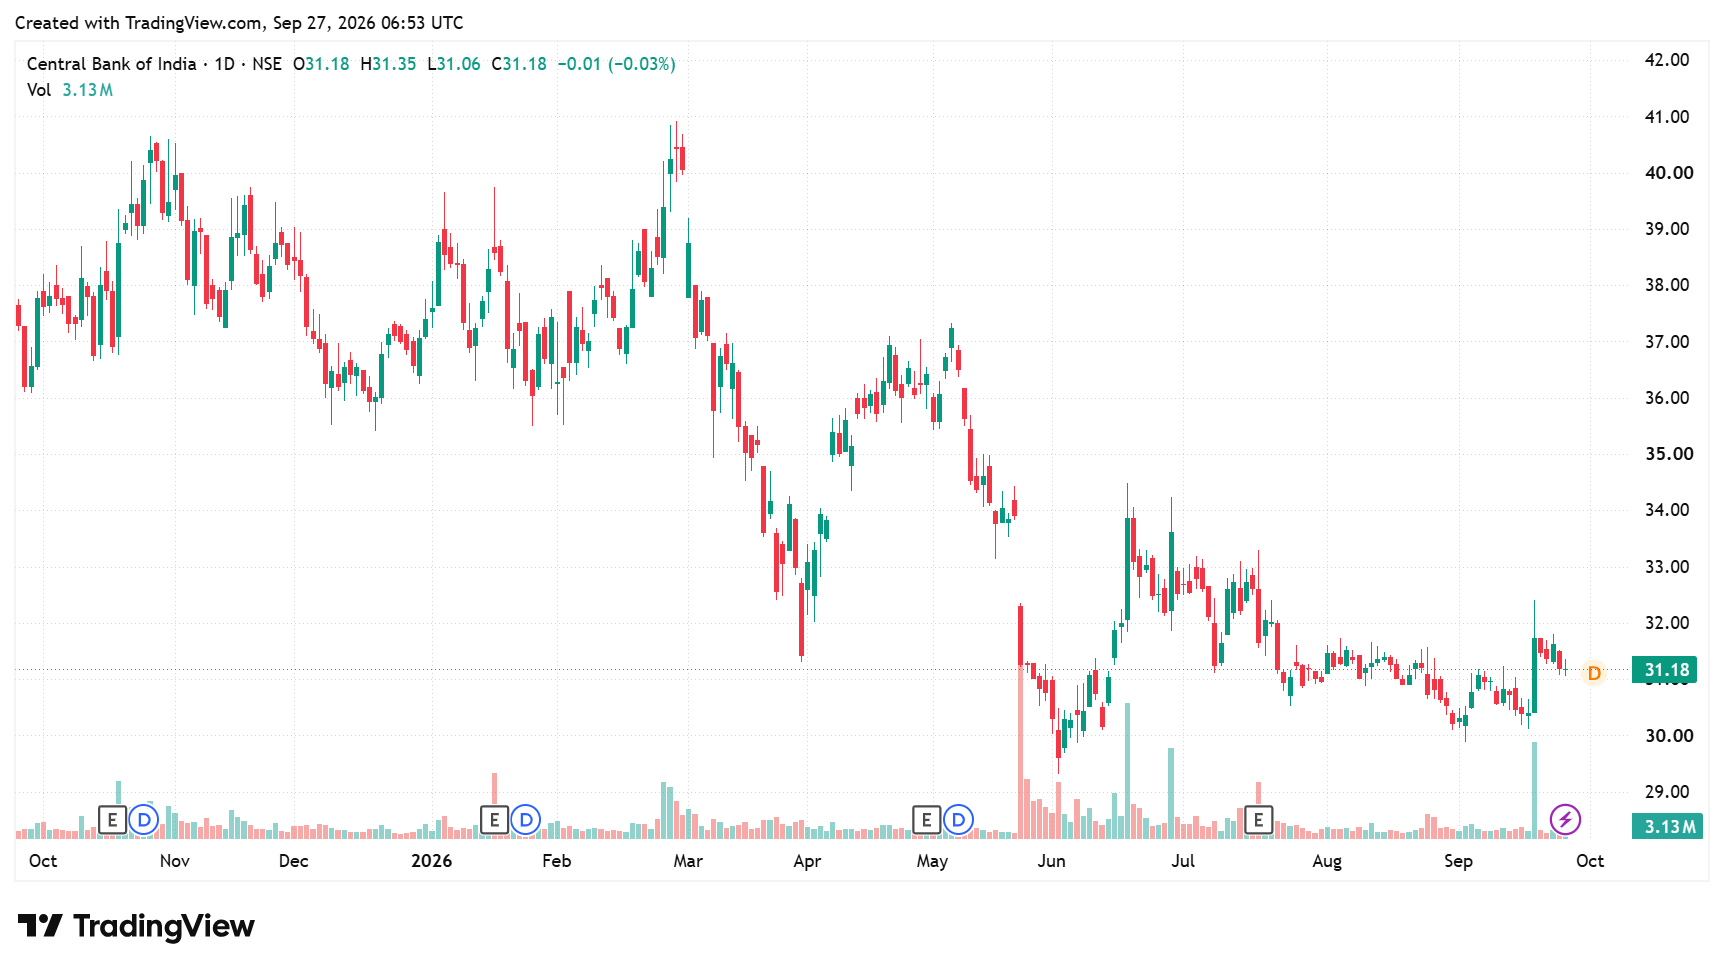
This translates to a dividend yield of 3.8% at the current price (as of September 25) of ₹31.2. The bank isCentral Bank of India. So, the question is: can Central Bank of India sustain its dividend payouts as it resumes its dividend journey?
| Financial Year | Dividend/Share | Standalone Net Profit | Payout Ratio |
| FY22 | NA | ₹1045.0 crore | NA |
| FY23 | NA | ₹1,582.0 crore | NA |
| FY24 | NA | ₹2,549.0 crore | NA |
| FY25 | ₹0.19 | ₹3,785.0 crore | 4.5% |
| FY26 | ₹1.20 | ₹4,369.0 crore | 24.9% |
| Source: Screener.in, Annual Report | |||
Central Bank of India Share Price
Central Bank of India’s FY26 Core Engine: RAM Lending and Margin Defence
The Central Bank of India earns its primary revenue from interest income through its lending operations to retail borrowers, agricultural clients, and corporate accounts. It also earns interest on its investment portfolio, which consists mainly of Government securities.
In addition, the bank generates non-interest income from commissions and fees, treasury operations, and recoveries from written-off accounts. In FY26, the bank’s total income grew 7.7% year-on-year to ₹42,342 crore. Total Interest Income expanded by 7.0% to reach ₹36,026 crore, while Net Interest Income (NII) grew by 2.0% to ₹14,171 crore with margins at 3.07%.
Interest earned on advances grew 7.7% to ₹24,050 crore, while interest on investments stood at ₹10,210 crore. Non-Interest Income grew by 11.9% to ₹6,316 crore. The growth in earnings was also supported by expansion in the loan book.
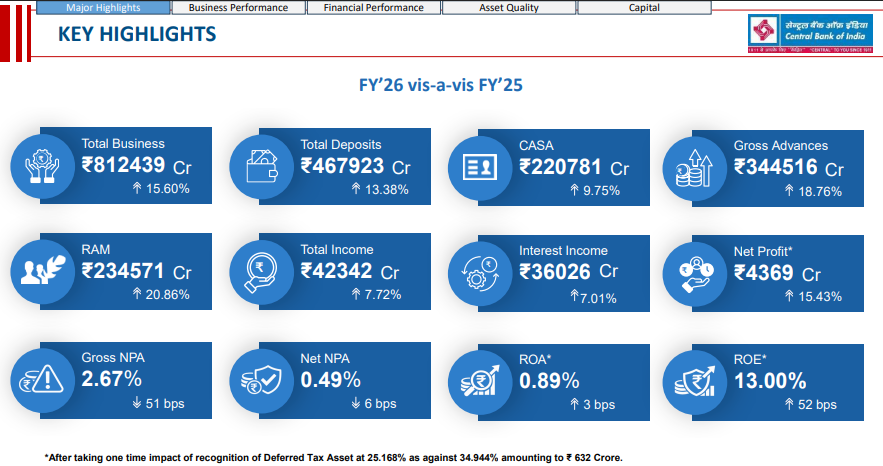
Gross advances surged by 18.8% to reach ₹3,44,516 crore, supported by 20.9% growth in Retail, agriculture and MSME (RAM) lending to ₹2,34,571 crore. Of this, retail advances rose 25.7% to a record ₹1,03,533 crore. The bank also recovered ₹2,270.7 crore from written-off accounts.
Consequently, net profit surged 15.4% to ₹4,369 crore, even after a one-time tax adjustment of ₹632 crore. This earnings base provides the bank with financial room to fund distributions, as the bank can pay dividends only from the current year’s profit. The bank must first transfer at least 20% of its annual net profit to the Statutory Reserve Fund before declaring any dividend.
Accordingly, in FY26, Central Bank of India transferred ₹1,092.2 crore (25%) to the statutory reserve fund and paid ₹1,086.2 crore as dividend, equivalent to 24.86% of net profit.
However, if the distributable net profit (₹2,988.6 crore) is considered after accounting for the statutory reserve of ₹287.8 crore and the investment fluctuation reserve, the payout ratio is 36.3%. This also aligns with the Government of India instructions for public sector banks (PSBs).
PSBs aim to pay a minimum dividend of 20% of paid-up equity capital or 20% of net profits, whichever is higher. The maximum permissible Dividend Payout Ratio is capped at 40% of net profits and is determined by CRAR and Net NPA. Therefore, sustaining dividends depends not only on profitability but also on the bank’s asset quality and capital position.
Credit Clean-Up: Sub-0.5% Net NPA and PCR Buffer Protect Payouts
The bank’s gross non-performing assets (NPAs) stood at 2.67% (down 51 bps), while net NPAs stood at 0.49% (down 6 bps). Fresh slippages dropped to a multi-decade low of 1.16%. Real-time identification and intervention before accounts defaulted kept the slippages low. The bank’s recovery from written-off accounts also grew 77% year-on-year during the year.
These recoveries directly bolstered non-interest income and bottom-line profit. The Provision Coverage Ratio stood at 95.97%, providing a strong cushion against potential deterioration in asset quality. Lower credit losses mean fewer earnings are absorbed by bad loan provisions, leaving more profit available for distribution.
The improvement in asset quality also supports dividend sustainability, as the dividend policy clearly states that Net NPA must be less than 7% as per the Reserve Bank of India (RBI). If the CRAR is at least 9% only in the current year, Net NPA must be below 5%. In Central Bank of India’s case, asset quality and capital are quite strong.
Capital Solvency: 17.91% CRAR Creates Headroom Above RBI Thresholds
The bank also needs to maintain sufficient capital after distributing profits to shareholders. The bank’s balance sheet maintains capital cushions well above regulatory requirements. The Capital to Risk-Weighted Assets Ratio (CRAR) stood at 18.28% in Q1FY27 and 17.91% in FY26, which is above the mandated Basel III regulatory threshold of 11.50% and 9.5% for Tier-I Capital.
This strong capital buffer is one of the key factors the bank’s Board of Directors assesses before declaring dividends. CRAR indicates the capital cushion available to absorb potential losses relative to risk-weighted assets. The policy mandates a minimum CRAR of 9% for the preceding two completed fiscal years and the year for which the dividend is declared.
Accordingly, CRAR stood at 15.08% in FY24, 17.02% in FY25 and 17.91% in FY26, satisfying the capital adequacy criteria for FY26. At the same time, the bank does not distribute all its profits to shareholders. A portion is retained in reserves, which can support future lending, branch expansion and digital investments.
This ensures the bank stays financially strong and protected from unexpected losses. As of March 31, 2026, Central Bank of India held standalone Reserves and Surplus of ₹29,419.2 crore, up 7.2% year-on-year. Net worth stood at ₹34,599.72 crore. The Board evaluates this capital base to ensure that dividend payouts do not hamper future business expansions.
Regulatory Stress Test: How Central Bank Clears RBI’s Dividend Matrix:-
| Policy Criterion | RBI & Policy Benchmark | Central Bank FY26 Actual | Status |
| Capital Adequacy (CRAR) | More than 9% for three consecutive years | 15.08% (FY24), 17.91% (FY26), 17.02% (FY25) | Compliant |
| Net NPA Threshold | <7.00% or <5.00% for single-year CRAR | 0.49% | Compliant |
| Statutory Reserve Transfer | Minimum 20% of annual net profit | 25.0% (₹1,092.15 crore) | Compliant |
| Government PSB Ceiling | More than 20% of paid-up capital or net profit | 24.86% of net profit | Compliant |
| Maximum Payout Ceiling | Capped at 40.0% | 24.8% (Standalone) 36.3% (Distributabe) | Compliant |
| Source: Annual Report and Dividend Distribution Policy | |||
Earnings Spread: Why Low Deposit Costs Protect FY27 Dividends
The bank’s ability to sustain dividends ultimately depends on its ability to generate earnings. For a bank, one of the key drivers of earnings is the spread between the return generated on loans and the cost of funding those loans. Central Bank of India maintains a deposit-based franchise to fund its lending.
Domestic deposits constitute over 93% of the bank’s core resource pool. This is supported by a CASA deposit base of ₹2,20,781 crore, representing 47.3% of total deposits. Savings deposits alone crossed the ₹2,00,024 crore mark. The bank’s cost of deposits stood at 4.82%, with total deposits of ₹4,67,923 crore.
A strong Current Account Savings Account (CASA) ratio of 47.3% helped keep deposit funding costs under control. Meanwhile, Cost of Funds (4.83%) is nearly identical to its Cost of Deposits (4.82%). This is because the Central Bank of India relies almost entirely on customer deposits to fund its operations.
Cost of Funds measures the total blended interest rate the bank pays across its interest-bearing liabilities. This includes customer deposits, market borrowings and interbank liabilities. On the other hand, the bank earned a yield of 8.21% on its ₹3,44,516 crore gross loan book and generated ₹24,050 crore in interest income from advances.
The difference between what the bank earns on its loans and what it pays to fund them is an important driver of its profitability. With a Cost of Funds of 4.83% and an Advances yield of 8.21%, the bank maintained an interest spread of 3.38%. This ultimately translated into a Net Interest Margin (NIM) of 3.07% and ₹14,171 crore of NII in FY26.
This funding structure therefore completes the dividend story. Strong deposit mobilisation keeps funding costs contained. A growing loan book supports interest income. Improving asset quality reduces credit costs. A strong capital position provides room to distribute a portion of the resulting profits to shareholders. This is further supported by the Dividend Distribution Policy.
Valuation Discount: 0.69x Book Value vs Sector Median
Central Bank of India’s dividend story is supported by a combination of strong profit growth, improving asset quality and a comfortable capital position. After resuming dividends in FY25, the bank increased its dividend per share more than sixfold to ₹1.20 in FY26.
The bank’s improving asset quality also provides support, while a Provision Coverage Ratio of 95.97% provides a strong capital buffer. At the same time, a CRAR of 17.91% in FY26 provides a substantial capital cushion even after dividend distribution.
However, the dividend remains linked to profitability, capital adequacy, asset quality and regulatory requirements. The bank also needs to retain sufficient capital to support its growing loan book. Therefore, future dividend growth will ultimately depend on how quickly profits grow while maintaining its capital and asset-quality buffers.
Valuation Check: Multiples Signal Margin of Safety
Valuation remains among the lowest across listed Indian public sector lenders. The bank trades at a Price-to-Book (P/B) multiple of 0.69x, below its five-year median of 0.9x and PSB multiple of 0.96x.
Looking ahead, for FY27, the Central Bank of India targets 14-15% growth in total business, with deposits expected to grow 10-12% and advances 14-16%. The bank also targets an NIM above 3%, an ROA of at least 1% and a CASA of around 48%. Q1FY27 was broadly on track, with NIM at 3.06%, ROA at 1% and net profit growth of 13.3% to ₹1,324 crore.
These targets are important for dividend sustainability, as payouts depend on current-year profits after statutory reserve transfers. On asset quality, the bank targets Gross NPA below 2.5%, Net NPA below 0.5% and PCR of 96-98%. With Net NPA at 0.49% and CRAR at 18.28% in Q1FY27, the bank remains comfortably above the regulatory thresholds for dividend eligibility.
Dividend Hunters can keep this stock on their watchlist.
Disclaimer:
Note: Throughout this article, we have relied on data from http://www.Screener.in and the company’s investor presentation and conference call. We used an alternative, widely accepted source of information only when the data were unavailable.
The purpose of this article is only to share interesting charts, data points, and thought-provoking opinions. It is NOT a recommendation. If you wish to consider an investment, we strongly advise you to consult your advisor. This article is strictly for educational purposes only.
About the Author: Madhvendra has been deeply immersed in the equity markets for over seven years, combining his passion for investing with his expertise in financial writing. With a knack for simplifying complex concepts, he enjoys sharing his honest perspectives on startups, listed Indian companies, and macroeconomic trends.
A dedicated reader and storyteller, Madhvendra thrives on uncovering insights that inspire his audience to deepen their understanding of the financial world.
Disclosure: The writer and his dependents do not hold the stocks discussed in this article.
The website managers, their employees (s), and contributors/writers/authors of articles have or may have an outstanding buy or sell position or holding in the securities, options on securities, or other related investments of issuers and/or companies discussed therein. The articles’ content and data interpretation are solely the personal views of the contributors/ writers/authors. Investors must make their own investment decisions based on their specific objectives and resources, and only after consulting any independent advisors as necessary.