




Welcome to the latest edition of Dividend Hunter. In recent weeks, we have analysed companies where strong cash flows could translate into consistent dividends going forward. In our previous edition, we covered a Mumbai-based commercial real estate player offering a 4.8% dividend yield. This week, we turn to a reinsurance company with a 52% market share.
Our Dividend Hunter pick for this week is a company that provides reinsurance support to every domestic non-life insurer and over 23 life insurance companies in India. The global reinsurance market is expected to grow from US$ 642 billion in 2023 to over US$ 2,001 billion by 2034. Meanwhile, insurance penetration in India remains low, offering significant headroom for reinsurers to capture future demand.
To this end, the company operates internationally, with a presence in approximately 137 countries, including London, Dubai, and Malaysia, as well as South Africa, the UK, and Russia. With a market cap of ₹60,922 crore, General Insurance Corporation of India (GIC Re) receives “obligatory cessions,” a compulsory percentage of all policies underwritten in India.
This gives it a predictable recurring stream of premiums. The company’s gross premium stood at ₹44,007 crore in FY26 and ₹13,475.4 crore in Q1FY27. GIC Re redirects the premium reserves into a diversified investment portfolio. As of Q1FY27, the portfolio’s market value was ₹1,57,891 crore (book value ₹1,20,224 crore).
GIC Re Portfolio-Mix
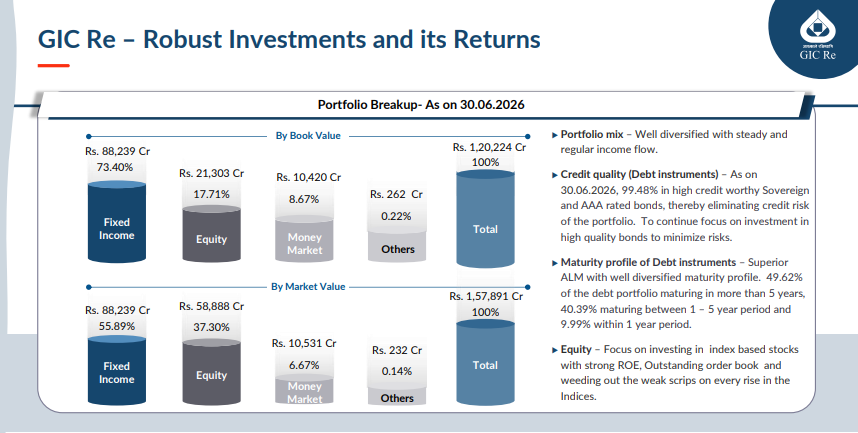
To reduce credit risk, 99.5% of its debt investments are held in sovereign and high-grade AAA-rated bonds. This conservative strategy yielded ₹13,089.3 crore in interest and dividend income in FY26. This income protects the company during high-claim years. Consequently, GIC Re has been consistently rewarding its shareholders.
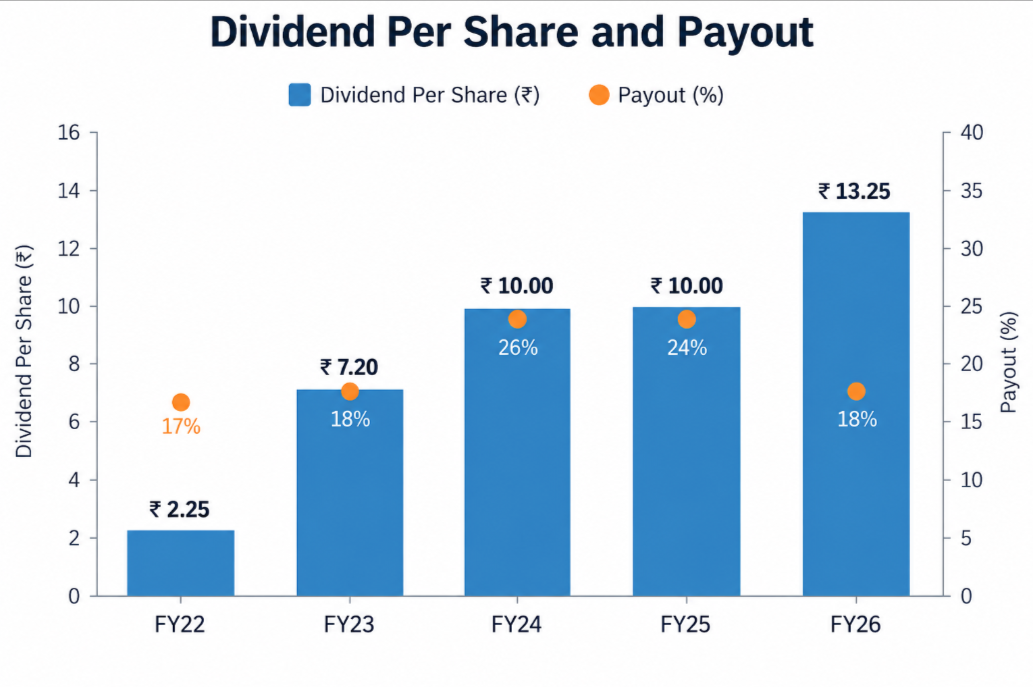
It paid a dividend of ₹13.25 per share for FY26, amounting to a total payout of ₹2,324.6 crore. The per-share payout was 32.5% higher than the ₹10 paid in FY24 and FY25. This highlights that GIC Re not only pays dividends but can also increase them. The company usually declares a final dividend every year.
The company has been a consistent dividend payer. In addition to dividends, its share price has also delivered returns at a 19% CAGR over the last five years. But can its financial performance remain strong enough to sustain these dividends in the years ahead? Let’s start with its business model.
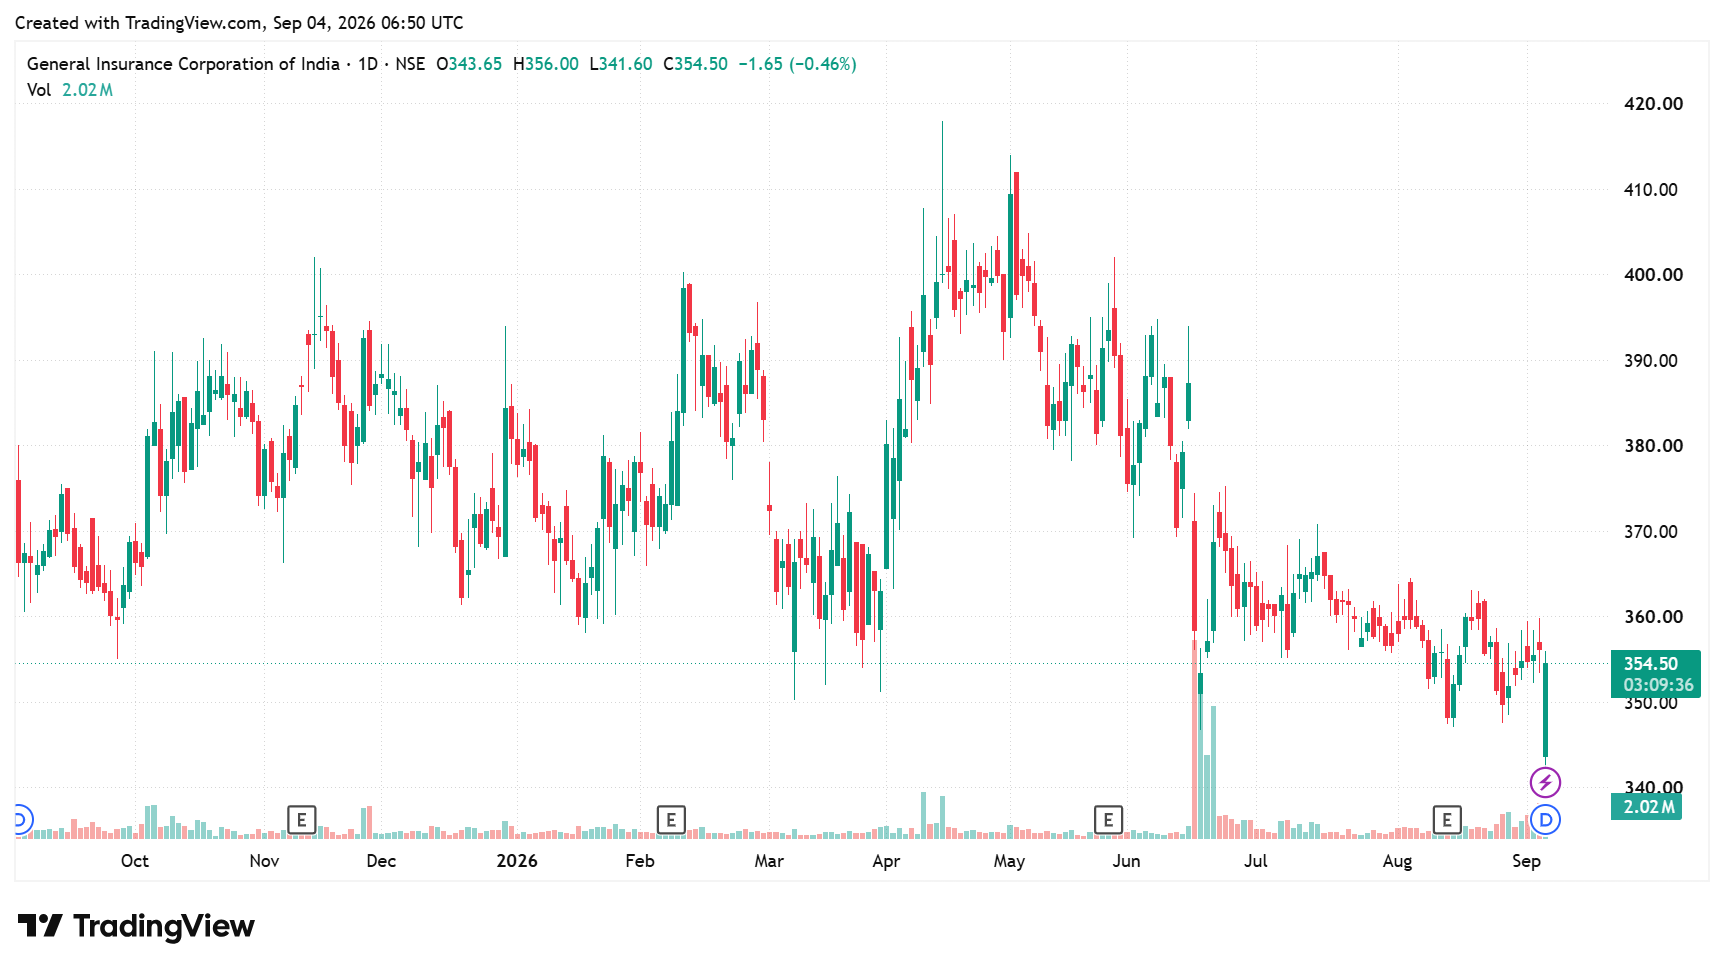
Underwriting Turnaround: How Combined Ratios Dropped to 106%
The company’s gross premium rose 6.9% year-on-year to ₹44,006.7 crore in FY26. This is the total premium it received from insurers for providing reinsurance cover. The premium mix is diversified across Fire (32%), Health (21%), Motor (17%), Agriculture (8%), Life (6%) and others (16%).
After accounting for the premium it passed on to other reinsurers, its net premium stood at ₹40,571 crore, up 7.2%. This implies that GIC Re not only wrote more business but also retained a higher portion of the premium, with net premium growth marginally ahead of gross premium growth.
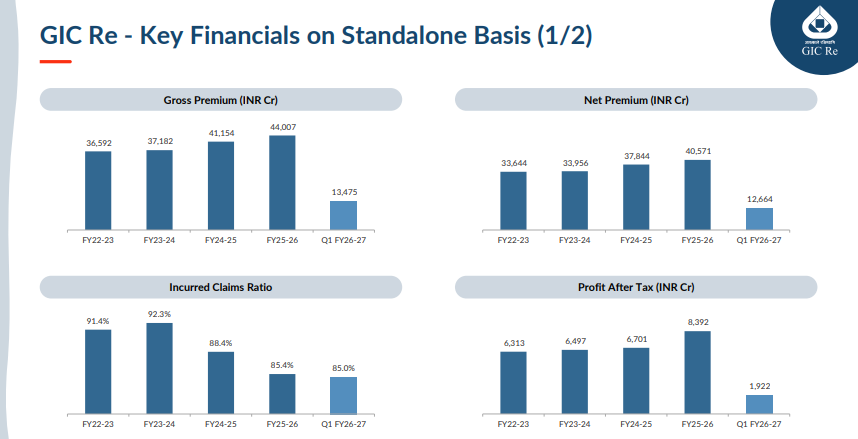
Meanwhile, GIC Re’s steady investment income grew by 2.48% to reach ₹13,089.3 crore. At the same time, standalone net profit surged by 25.2% to reach ₹8,392.2 crore.
A major driver of GIC Re’s profitability was the turnaround in its core operating performance. The company became more selective about the risks it took and kept a tighter check on claims. This helped it reduce its underwriting loss by 47.4% to ₹1,763 crore during the year.
The improvement was also visible in its incurred claims ratio, which fell to 85.4% from 88.4% in FY25. In simple terms, GIC Re spent less on claims than the premium it earned. Its combined ratio also improved to 106.0% from 108.8%. A combined ratio of 106% means it spends about ₹106 on claims and expenses. So, it makes an underwriting loss of roughly ₹6.
A ratio below 100% would mean the insurance business itself is making an underwriting profit. Although the ratio remained over 100%, the lower ratio shows that the company’s underwriting performance improved. This helped push its Return on Equity (ROE) to 16.4%. Net worth (excluding fair value changes) rose by 19.01% to end the year at ₹51,301.3 crore.
This performance continued into Q1FY27. GIC Re’s gross premium income grew by 8.8% year-on-year to ₹13,475.4 crore. Investment income, however, declined by 1.5% to ₹3,265.5 crore. Net profit rose 9.7% to ₹1,922 crore. Key performance indicators continued to strengthen in Q1FY27.
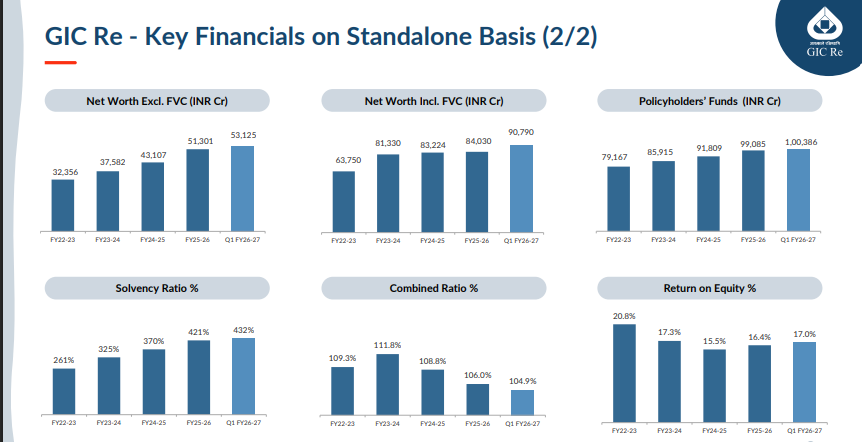
The incurred claims ratio improved to 85.0%, down from 90.4% in Q1FY26. This lower claim volume helped improve the combined ratio to 104.9%, down from 106.9%. Consequently, GIC Re’s annualised ROE rose to 17%, while its net worth reached ₹53,125 crore. Most notably, the company’s solvency ratio rose to a record high of 4.3.
Looking ahead, over the next 2 to 3 years, GIC Re aims to reach a combined ratio of 103 (current 107.5) for its domestic book and 95 for its foreign book. A lower combined ratio would not only improve underwriting profitability but could support stronger earnings. Improved earnings bodes well for future dividend payouts.
Capital Safety: How A 4.3 Solvency Multiple Secures Claims
This solvency margin is about 3x the regulatory requirement of 1.5. This gives the company a strong capital cushion to meet its claims and other obligations. The primary driver of GIC Re’s dividend-paying capacity is the direct cash flow generated from its investments.
Solvency & Cash Reserves: Evaluating The ₹27,790-Cr Safety Cushion
In FY26, GIC Re received ₹8,734.4 crore in cash from its investment portfolio in the form of rent, interest, and dividends. The cash generated from these investments is approximately 3.75X the annual dividend distributed by GIC Re.
Further, GIC Re maintains a large cash cushion to absorb any operational volatility. As of 31 March, 2026, the company’s standalone Cash and Bank Balances stood at ₹27,791.2 crore. Out of this, ₹15,224.1 crore has been invested in fixed deposits, generating steady interest income.
Another ₹5,555.1 crore is kept as deposits under margin for letters of credit. The balance ₹7,012 crore is cash and cash equivalents. Overall, higher net profit, investment income, net worth, and a higher solvency ratio enable the company to reward shareholders with dividends.
Can Stronger Earnings Support Higher Dividends?
GIC Re declared a final dividend of ₹13.25 per equity share for FY26. At the current price of ₹341, the dividend yield translates to around 3.9%. The payout is the highest in the last five years, compared with ₹10 per share in FY25 and FY24, ₹7.2 in FY23 and ₹2.25 in FY22. Dividend payout has been consistent between 20-27% during the period.
The 30% of Profit or 4% of Net Worth Dividend Guideline
This implies that dividends could increase if net profit grows consistently. The Dividend Distribution Policy also provides visibility of consistent payout. Department of Investment and Public Asset Management guidelines state that Central Public Sector Undertakings may strive to pay a dividend based on the higher of 30% of profit or 4% of net worth.
For instance, on a standalone basis, the FY26 payout of ₹2,324.6 crore was slightly lower than 30% (₹2,517.7 crore) of its net profit of ₹8,392.2 crore. However, this payment exceeded the 4% threshold of its net worth of ₹51,301.3 crore.
This shortfall is due to the mandatory transfer of 10% of its operating profits from its Fire, Marine, and Miscellaneous segments to a Catastrophe Reserve to absorb future extreme losses.
That said, the guidelines support regular dividend payments as the company’s profit and net worth grow. To this end, the company has set a directional overall growth target of roughly 10%, which augurs well for the company’s profitability. However, weak profitability could also hamper the payout. For instance, during FY20 and FY21, it paid no dividend due to the pandemic.
The Dividend Hunter Verdict
The company could sustain its dividend in the near term. Improving profitability, better underwriting performance, and a strong investment portfolio support continued payouts. Its large capital base and high solvency ratio also give it room to absorb claim volatility.
However, the dividend should not be viewed as guaranteed. The company’s payout depends on its profitability, claim ratio and investment income. If these weaken sharply, dividends could come under pressure, as seen during FY20 and FY21.
The company also trades at a Price-to-Book (P/B) multiple of 0.9, below the 10-year median P/B of 1.1 and the General Industry median of 4.5x. At the current valuation, the stock also offers a potential for further growth if earnings continue to improve. Dividend hunters should keep this stock on their watchlist.
Disclaimer:
Note: Throughout this article, we have relied on data from http://www.Screener.in and the company’s investor presentation and conference call. We used an alternative, widely accepted source of information only when the data were unavailable.
The purpose of this article is only to share interesting charts, data points, and thought-provoking opinions. It is NOT a recommendation. If you wish to consider an investment, we strongly advise you to consult your advisor. This article is strictly for educational purposes only.
About the Author: Madhvendra has been deeply immersed in the equity markets for over seven years, combining his passion for investing with his expertise in financial writing. With a knack for simplifying complex concepts, he enjoys sharing his honest perspectives on startups, listed Indian companies, and macroeconomic trends.
A dedicated reader and storyteller, Madhvendra thrives on uncovering insights that inspire his audience to deepen their understanding of the financial world.
Disclosure: The writer and his dependents do not hold the stocks discussed in this article.
The website managers, their employees (s), and contributors/writers/authors of articles have or may have an outstanding buy or sell position or holding in the securities, options on securities, or other related investments of issuers and/or companies discussed therein. The articles’ content and data interpretation are solely the personal views of the contributors/ writers/authors. Investors must make their own investment decisions based on their specific objectives and resources, and only after consulting any independent advisors as necessary.