




Welcome to the latest edition of Dividend Hunter. In recent weeks, we have analysed companies where strong cash flows could translate into consistent dividends. In our previous edition, we covered a diversified public sector company that delivered a 5% dividend yield and doubled profits.
This week, in our Dividend Hunter series, we discuss another Navratna central public sector enterprise and an NBFC-infrastructure finance company. The company finances housing and urban infrastructure development across India. Its net profit has grown at a 20% CAGR over the last five years, while the stock price has returned at a 31% CAGR during the same period.
The company has also returned over 30% of its Net Profit to shareholders through regular annual dividend distributions. For FY26, it declared a dividend of ₹1,211.2 crore. This payout included four interim dividends totaling ₹910.9 crore and a final dividend of ₹300.3 crore. The dividend yield stood at 3.6%.
The company is Hudco.
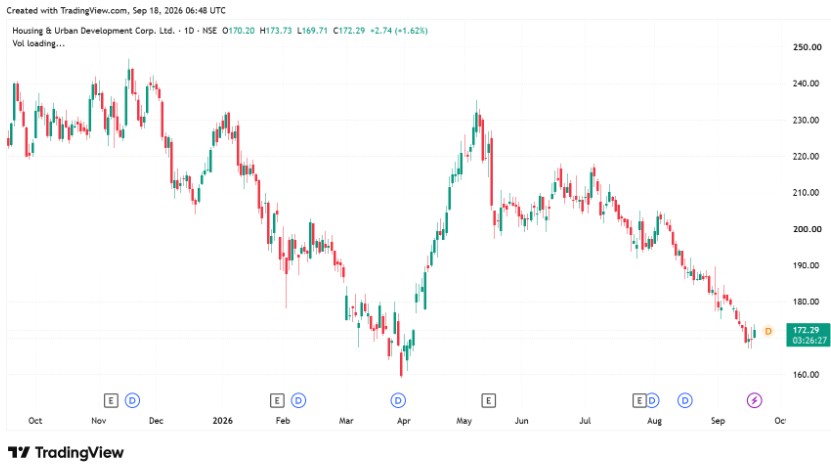
HUDCO Dividend Track Record: Why Profit Growth Outpaced Payouts
Hudco paid a per-share dividend of ₹6.05 in FY26, translating into a dividend yield of 3.6% at the current price (as of 17 September) of ₹170. During the year, the company paid four interim dividends and a final dividend of ₹1.5. The dividend per share has nearly doubled from ₹3.5 in FY22, and the company has consistently increased it since then.
| Financial Year | Dividend/Share | Net Profit | Payout Ratio |
| FY22 | ₹3.50 | ₹1,716.0 crore | 41.0% |
| FY23 | ₹3.85 | ₹1,701.0 crore | 45.0% |
| FY24 | ₹4.15 | ₹2,117.0 crore | 39.0% |
| FY25 | ₹4.15 | ₹2,709.0 crore | 31.0% |
| FY26 | ₹6.05 | ₹4,034.4 crore | 30.0% |
| Source: Screener.in, Annual Report | |||
Revenue Engine: 27% Top-Line Expansion Powers Cash Returns
Sustained financial growth drives Hudco’s dividend capacity, enabling regular cash transfers to shareholders. In FY26, the company’s revenue grew 27.5% year-on-year to ₹13,150.4 crore, while interest income grew 28% to ₹13,096 crore. Net profit surged 48.9% to ₹4,034.4 crore. Financial momentum continued in Q1FY27.
Revenue grew 26.6% year-on-year to ₹3,717 crore, while net profit surged 35.1% to ₹851 crore. Payouts depend directly on the net profits earned during the financial year and the company’s accumulated net worth. The company’s payout has consistently been above 30%, although it has declined recently due to rapid profit growth.
Asset Quality Guardrails: Low NPAs Anchor Sustainable Cash Flows
Estimated cash inflow from loan collections depends directly on Hudco’s asset quality and portfolio mix. Its loan-mix shows a multi-year pivot toward urban infrastructure development. As of Q1FY27, urban infrastructure financing accounts for 74.7% of the total loan book.
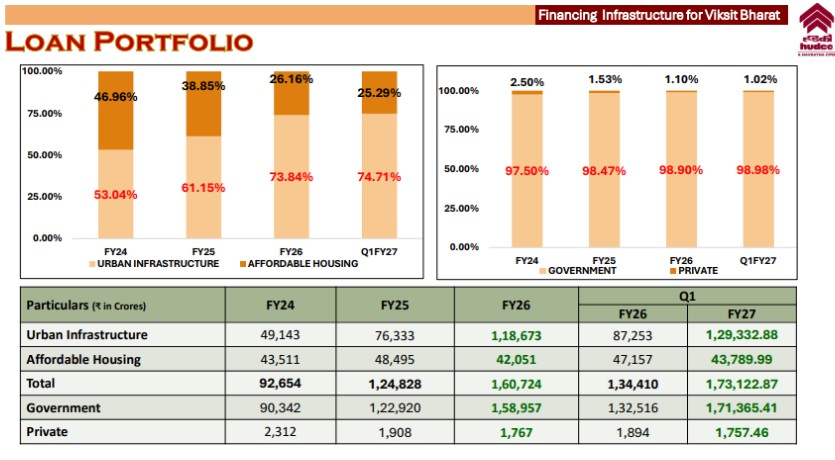
Affordable housing projects make up the remaining 25.3%. The mix has improved from FY24, when affordable housing held a 47% share and urban infrastructure stood at 53%. Government entities continue to dominate the borrower profile. This sovereign and state-backed borrower profile reduces default risk and stabilizes the loan recovery cycle.
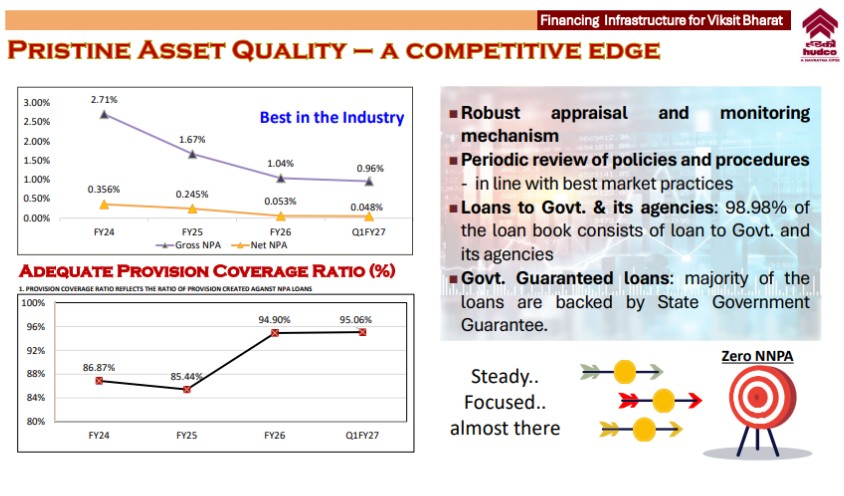
The company’s gross non-performing assets (NPAs) stood at 0.96% and net NPAs at 0.048% in Q1FY27. A high provision coverage ratio of 95.06% provides strong risk protection, protecting net profit from sudden asset impairment losses. This is another important metric, as keeping credit default risk low is essential for maintaining asset quality and profitability.
Capital Cushion: 39.4% CRAR Secures Regulatory Payout Room
Hudco’s balance sheet maintains capital cushions well above regulatory requirements, allowing capital distribution without restricting lending growth. The Capital to Risk-Weighted Assets Ratio (CRAR) stood at 39.4% in Q1FY27 and is significantly above the mandated 15% threshold. This is one of the factors the Board of Directors assess before declaring a dividend.
CRAR indicates the capital cushion to absorb potential losses. A higher CRAR generally means Hudco has a stronger capital position relative to its lending risks. Hudco’s net worth stood at ₹22,867.3 crore as of Q1FY27. Further, efficient liability management keeps borrowing costs low, protecting net interest margins and operating cash flows.
Borrowing Dynamics: Sub-7% Cost of Funds Protects Net Margins
Hudco maintains a diversified borrowing mix to fund its growing lending commitments. Grand total borrowings reached ₹1,53,176.27 crore in Q1 FY27. Domestic funding sources supply over 70% of the total borrowing pool. Bank Loans (46.74%), Bonds (39.87%), foreign currency loans (10.4%), and Refinance Assistance (2.99%) support the borrowing mix.
The cost of borrowings stood at 6.95% during Q1FY27. To optimize interest costs, management aims to increase the share of foreign currency borrowings from 10% toward 20% over time. Hudco’s yield on loan assets stood at 8.78%, including Extra Budgetary Resources, in Q1FY27, down from 9.08% in Q1FY26 and 9.13% in FY26.
On the borrowing side, the overall cost of funds declined to 6.95% in Q1FY27 from 7.17% as of March 2026. The cost and availability of funds influence how much capital the company retains internally versus pays out. The Net Interest Margin (NIM) stood at 2.72% in Q1FY27. The interest spread for Q1FY27 came in at 1.83%.
Liability Structure: Why Foreign Borrowings Could Expand NIM to 3%
Management is actively working to maintain a core interest spread of around 2% and expects long-term NIM to remain near 3%. NIM expansion could be a key driver of profitability. Key return metrics reflected positive momentum during the quarter.
Annualized Return on Assets improved to 1.97% in Q1FY27 from 1.89% in Q1FY26. Annualized Return on Equity expanded to 14.89% in Q1FY27. The board also reviews liquidity and cash generation to ensure sufficient cash is available for ongoing operations and debt servicing.
In FY26, Hudco maintained an average quarterly Liquidity Coverage Ratio between 152.66% and 199.75%, above the regulatory requirement of 100%.
The CPSE Mandate: Net Worth Thresholds That Govern Dividend Outflows
The Dividend Distribution Policy also supports the payout. As a Central Public Sector Enterprise (CPSE) and NBFC, Hudco must pay a minimum annual dividend of 30% of net profit or 4% of Net Worth, whichever is higher. In FY26, the company’s dividend payout of ₹1,211.2 crore was 30.02% of net profit (₹4,034.4 crore) and 6.06% of FY26 net worth (₹19,973.5 crore).
This is subject to the maximum limit prescribed by the Reserve Bank of India (RBI). Also, before declaring any dividend, Hudco must transfer at least 20% of its net profit into a Statutory Reserve Fund. Thus, if profitability declines, the dividend payout may also fall. Losses in any year could further reduce or eliminate the dividend payout.
Growth Runway: How a ₹2.5 Lakh Crore Sanction Pipeline Backs the 2030 Target.
Hudco has multiple growth levers. Hudco has set a target to expand its infrastructure loan portfolio to ₹3 lakh crore by 2030, up from ₹1.7 lakh crore as of Q1FY27. This would be a shift to a broader infrastructure financier. To fund this expansion, Hudco maintains an outstanding sanction pipeline of approximately ₹2.5 lakh crore.
It has also signed state and institutional MoUs worth over ₹6.5 lakh crore. These MoUs are structured over a 5-year execution timeline for project formulation and disbursement. The company also aims to become a zero-net-NPA organization. Expanding the loan book and lower net NPA augurs well for Hudco’s profitability.
The Dividend Hunter Verdict
Hudco’s dividend story is supported by strong profit growth, improving asset quality and a well-capitalised balance sheet. Net profit has grown at a 20% CAGR over the last five years, while the dividend per share has nearly doubled from ₹3.5 in FY22 to ₹6.05 in FY26.
The payout ratio, however, has declined from 41% in FY22 to around 30% in FY26 as profits have grown faster than dividends. With a CRAR of 39.4%, net worth of ₹22,867.3 crore and a liquidity coverage ratio well above the regulatory requirement, Hudco retains a sizeable financial cushion. Its low net NPA and high provision coverage also support earnings quality.
However, the dividend remains linked to profitability, net worth, regulatory requirements and the company’s liquidity needs. Hudco therefore combines growing dividends with strong financial strength, although future payout growth may not match the pace of profit growth.
Hudco Valuation Check: Multiples Signal Margin of Safety
Valuation also offers some comfort. Hudco trades at a Price-to-Book (P/B) multiple of 1.35x, below its five-year median of 1.9x and the Financial Institutional sector multiple of 2.06x. Dividend Hunters can keep this stock on their watchlist.
Disclaimer
Note: Throughout this article, we have relied on data from http://www.Screener.in and the company’s investor presentation and conference call. We used an alternative, widely accepted source of information only when the data were unavailable.
The purpose of this article is only to share interesting charts, data points, and thought-provoking opinions. It is NOT a recommendation. If you wish to consider an investment, we strongly advise you to consult your advisor. This article is strictly for educational purposes only.
About the Author: Madhvendra has been deeply immersed in the equity markets for over seven years, combining his passion for investing with his expertise in financial writing. With a knack for simplifying complex concepts, he enjoys sharing his honest perspectives on startups, listed Indian companies, and macroeconomic trends.
A dedicated reader and storyteller, Madhvendra thrives on uncovering insights that inspire his audience to deepen their understanding of the financial world.
Disclosure: The writer and his dependents do not hold the stocks discussed in this article.
The website managers, their employees (s), and contributors/writers/authors of articles have or may have an outstanding buy or sell position or holding in the securities, options on securities, or other related investments of issuers and/or companies discussed therein. The articles’ content and data interpretation are solely the personal views of the contributors/ writers/authors. Investors must make their own investment decisions based on their specific objectives and resources, and only after consulting any independent advisors as necessary.