


The Nifty index is hovering around the crucial 26,000 mark, not far from its 52-week high. While many traders are wondering whether the market will print a fresh all-time high in November, the underlying sector rotation and improving D-street sentiment reflect a bullish undertone. The question on every investor’s mind: If the market remains bullish, which sector deserves your attention this month?
According to Seasonality Analysis, the answer is quite clear: Nifty India Defence .
Nifty India Defence Seasonality Analysis
Seasonality Analysis studies the historical monthly performance of sectors to understand the best-performing month in the past.

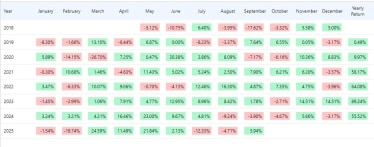
An average monthly gain of 6.73% is remarkable, especially when seen through a seasonal lens. This makes November the best-performing month for the index. With a 100% positive strike rate in November, the odds clearly favour bullishness in this space.
Before identifying stocks that may benefit from the seasonality trend, let’s first decode how the Nifty India Defence chart looks.
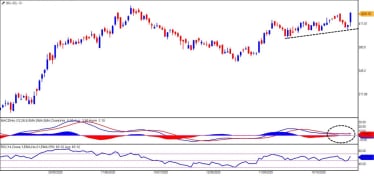
Nifty India Defence Daily Chart


On the daily chart, the index has been consolidating within a broader range of 7,800–8,400 since mid-September, forming a healthy base.
But what was more convincing was the reversal from 7,400 to 8,400, which witnessed a strong move with the bullish harami candlestick pattern on the weekly time frame and the morning star candlestick pattern on the daily chart. These candlestick patterns themselves speak to the strength in the reversal structure.
Adding to the reversal candlestick pattern, the bullish crossover on the MACD above the zero line signals the trend and momentum emerging for a bullish follow-up move.
On the RSI front, the oscillator remains consistently above the 50 mark, indicating a strong trend.
As the seasonality index signals a bullish month, the chart’s support indicates the sector in focus for the month.
Let us move to the defence stocks .
Bharat Electronics Ltd (BEL)
Bharat Electronics Ltd (BEL) continues to impress with its strong price action. The higher high–higher low structure, a bullish signal according to the Dow Theory, indicates the trend’s strength.
BEL Daily Chart
The recent breakout from the previous high of Rs. 425 indicates a shift in momentum in favour of the bulls.
On the indicator front, the bullish crossover on MACD and the slope of the RSI turning north from the bullish zone are signs of the trend’s strength and momentum.
If the stock manages to hold the key psychological level of Rs. 400, it may potentially head into uncharted territory above its all-time high of Rs. 436.
Dynamatic Technologies (DYNAMATECH)
Dynamatic Technologies, the mid-sized engineering and defence giant, with a market cap of over Rs. 5,000 crore, is gaining traction as a promising defence play on the charts.
DYNAMATECH Weekly Chart

The stock price faced multiple hurdles around Rs. 7,500 before breaking out in October, indicating the resumption of bullish momentum.
What’s more interesting is that the bullish shift in the Relative Strength Index (RSI) alongside the breakout prompted us to include this stock in the article.
When the stock price breaks out with strength, it is a sign of a renewed trend, and the momentum may take the stock higher towards its all-time high of Rs. 9,082.
Bharat Forge Ltd (BHARATFORG)
Bharat Forge , the Auto-Defence stock has been an underperformer since June 2024, as its peers in both the Auto and Defence sectors have outperformed.
However, this time it seems BHARATFORG is likely to catch up with its peer, and a probable move may be on the cards if the stock manages to break its hurdle placed at Rs. 1,362.
BHARATFORG Weekly Chart
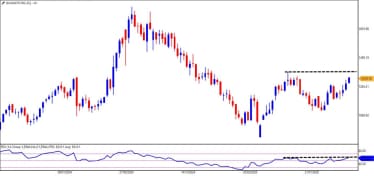
The lower high–lower low bearish structure from 2024 may come to an end if the stock price manages to break the level.
Interestingly, the break will change the structure to a higher high–higher low, a sign of a bullish reversal, as per the Dow Theory.
Additionally, the RSI is also on the verge of a breakout, indicating the bullish range shift on the weekly chart.
Conclusion
With bullish market sentiment and the Nifty signalling a bullish opportunity, Seasonality points toward Nifty India Defence, as November has delivered gains in all seven years, averaging nearly 6.73% returns.
The bullish candlestick signals, MACD crossover, and strength in RSI on the charts indicates a strong picture for the sector.
Note: The purpose of this article is only to share interesting charts, data points and thought-provoking opinions. It is NOT a recommendation. If you wish to consider an investment, you are strongly advised to consult your advisor. This article is strictly for educative purposes only.
Brijesh Bhatia is an Independent Research Analyst and is engaged in offering research and recommendation services with SEBI RA Number – INH000022075. He has two decades of experience in India’s financial markets as a trader and technical analyst.
Disclosure: The writer and his dependents do not hold the stocks discussed here.
The website managers, its employee(s), and contributors/writers/authors of articles have or may have an outstanding buy or sell position or holding in the securities, options on securities or other related investments of issuers and/or companies discussed therein. The content of the articles and the interpretation of data are solely the personal views of the contributors/ writers/authors. Investors must make their own investment decisions based on their specific objectives and resources, and only after consulting such independent advisors if necessary.


