




Strong revenue growth attracts attention. But when profits rise much faster than sales, it can indicate that a business is beginning to extract more earnings from each incremental rupee of revenue.
This can happen when fixed costs are spread over a larger revenue base, capacity utilisation improves or the product mix shifts towards higher-margin categories. In such cases, profit growth can materially outpace sales growth.
However, this relationship needs to be examined carefully. A low base, one-off gains or deteriorating working capital can also make profit growth appear unusually strong.
Our recent SME series examined smaller businesses linked to India’s infrastructure expansion, the railway supply chain, precision defence components and India’s maritime expansion. This time, we looked for companies where profit growth has significantly outpaced the expansion in the underlying business.
We began with our broader quality screen. Companies had to be SME-listed, with return on capital employed (ROCE) above 15% and average three-year ROCE above 15%. Debt-to-equity had to remain below 0.5, while cash flow from operations in the latest year had to be positive.
We also required three-year sales and profit growth above 10%, more than 100 shareholders, promoter holding above 30% with no decline in promoter stake, zero promoter pledging, debtor days below 150 and operating profit margin above 10%.
A total of 46 companies cleared these filters.
We then applied an additional condition: three-year profit growth had to be at least three times three-year sales growth. Only four companies met this threshold.
The final list contains three. Neetu Yoshi was excluded after an additional working-capital check. Its working-capital days increased from 20 in FY24 to 56 in FY25 and 133 in FY26, while debtor days also rose sharply. The deterioration suggested that a substantially larger amount of capital was getting tied up in the business alongside the rapid profit growth.
The three companies that remain therefore combine the broader quality filters with profit growth of at least three times sales growth, without a comparable deterioration in working-capital intensity.
#1 Virtual Galaxy Infotech: Profit CAGR Runs 4.2 Times Faster Than Sales Growth
Incorporated in September 1997, Virtual Galaxy Infotech (VGIL) is an IT services and consulting firm based in Nagpur, Maharashtra, India.
The company qualifies for this screen with a three-year sales compounded annual growth rate (CAGR) of 46% and profit CAGR of 195%. This means profit CAGR was about 4.2 times the sales CAGR over the period. Return on Capital Employed (RoCE) stood at 33.7%.
Virtual Galaxy Infotech’s Profit and Sales Growth Over the Years
| Particulars | 2022-23 | 2023-24 | 2024-25 | 2025-26 | CAGR |
| Sales (Rs crore) | 58 | 61 | 120 | 182 | 46% |
| Profit (Rs crore) | 2 | 16 | 32 | 46 | 195% |
Source: Screener.in
Note: CAGR is based on Screener’s underlying unrounded financial data. Figures in the table are rounded.
Why Did Profit Grow So Much Faster Than Sales?
A large part of the divergence emerged in FY24. Revenue increased only about 5%, from Rs 58 crore to Rs 61 crore, while profit rose from about Rs 2 crore to Rs 16 crore.
According to the company’s DRHP, Virtual Galaxy capitalised Rs 6.39 crore of employee costs relating to software and product development in FY24 instead of recognising the entire amount as an expense. It also capitalised certain costs linked to Build-Operate-Transfer projects as investments and intangible assets.
Purchases of stock-in-trade also fell sharply during FY24. These factors reduced expenses recognised through the profit and loss account and contributed to the sharp jump in margins and reported profit.
The 195% three-year profit CAGR is therefore influenced by both a low FY23 earnings base and the FY24 step-up in profitability. Margins, however, remained elevated in later years while revenue accelerated.
Scaling Banking Software and Overseas Operations
According to its FY26 results, revenue from operations rose 52% year-on-year (YoY) to Rs 182.1 crore from Rs 120.1 crore. Net profit increased 44% to Rs 46.1 crore from Rs 32.1 crore. FY26 operating margin stood at about 46%.
Virtual Galaxy is also building its overseas business. It signed a USD 1.099 million contract with Botswana Development Corporation for an integrated information management system. Its government technology business is expanding as well. The company has secured assignments under Maharashtra’s World Bank-assisted SMART programme, including digital systems for the state’s Animal Husbandry and Dairy Department.
Working Capital Trends: Assessing Cash Flow and Inventory Pressures
Working-capital days stood at 36 in FY26, compared with 2 in FY25 and 45 in FY24. While the figure increased from a low FY25 base, it remained below FY24. Debtor days improved to 64 from 68.
Virtual Galaxy Infotech’s Working Capital Days Over The Years
| Particulars | 2023-24 | 2024-25 | 2025-26 |
| Working Capital Days | 45 | 2 | 36 |
Source: Screener.in
Debt-to-equity stood at about 0.22 times. Promoter holding remained unchanged at 65% between September 2025 and June 2026.
The key monitorable is whether the higher margin structure can be sustained as the company scales. Collections and overseas execution remain important. SME stocks can carry lower liquidity and higher price volatility, warranting investor caution.
Virtual Galaxy Infotech Financial Performance
| Metric | FY26 |
| Revenue | Rs 182.1 crore |
| Revenue growth | 52% YoY |
| Net profit | Rs 46.1 crore |
| Profit growth | 44% YoY |
Source: Virtual Galaxy Infotech’s FY26 results
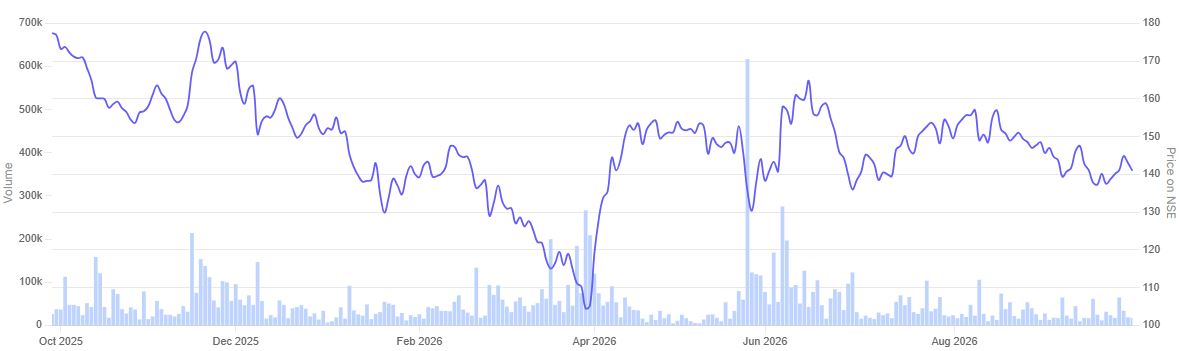
In the past year, the share price of Virtual Galaxy Infotech is down 21.1%.
Virtual Galaxy Infotech 1 Year Share Price Chart
Source: Screener.in
#2 Gayatri Rubbers and Chemicals: Profit CAGR Runs 3.5 Times Faster Than Sales Growth
Incorporated in 2022, Gayatri Rubbers and Chemicals is in the business of rubber manufacturing and trading.
The company qualifies for this screen with a three-year sales compounded annual growth rate (CAGR) of 23% and profit CAGR of 83%. Profit CAGR was therefore about 3.5 times sales CAGR. Return on Capital Employed (RoCE) stood at 37.9%.
Gayatri Rubbers and Chemicals’ Profit and Sales Growth Over the Years
| Particulars | 2022-23 | 2023-24 | 2024-25 | 2025-26 | CAGR |
| Sales (Rs crore) | 22.21 | 24.41 | 31.91 | 41.79 | 23% |
| Profit (Rs crore) | 0.91 | 1.56 | 2.85 | 5.59 | 83% |
Source: Screener.in
Why Did Profit Grow So Much Faster Than Sales?
Unlike Virtual Galaxy, the divergence here appears to be primarily operational. Gayatri has been shifting its business mix towards higher-margin specialised rubber products, particularly for railways and smart meters.
Management linked lower-margin architectural products have gradually given way to higher-margin railway applications. In FY26 earnings call transcript railways accounted for roughly 55% of revenue, while smart meters contributed about 20%. Management specifically identified higher-margin railway products as the main reason behind the improvement in profitability.
This shift is visible in margins. EBITDA margin increased from 11.3% in FY24 to 14.8% in FY25 and 21.1% in FY26. PAT margin rose from 6.4% to 8.9% and then 13.4% over the same period. In FY26, total income increased about 31% YoY to Rs 41.82 crore, while PAT rose 96% to Rs 5.59 crore.
Working Capital Trends: Assessing Cash Flow and Inventory Pressures
Working-capital days stood at 132 in FY24, 139 in FY25 and 122 in FY26. The latest figure therefore improved rather than deteriorating alongside the faster profit growth.
Gayatri Rubbers and Chemicals’ Working Capital Days
| Particulars | 2023-24 | 2024-25 | 2025-26 |
| Working Capital Days | 132 | 139 | 122 |
Source: Screener.in
However, inventory days increased to 210 in FY26 from 151 in FY25, while debtor days rose to 82 from 76. Operating cash flow was also only Rs 0.16 crore in FY26. Inventory conversion and collections therefore remain key monitorables.
SME stocks can carry lower liquidity, larger trading lots and higher price volatility. The company also reports half-yearly results, warranting additional investor caution.
We have already covered the company’s railway orders, Plant 2 ramp-up, RDSO approvals and promoter stake changes in our earlier detailed analysis of Gayatri Rubbers and Chemicals. Those developments are therefore not repeated here.
#3 Ameya Precision Engineers: Profit CAGR Runs 3.6 Times Faster Than Sales Growth
Incorporated in 1987, Ameya Precision manufactures pump and valve components and other engineering components used in valve Industry.
The company qualifies for this screen with a three-year sales compounded annual growth rate (CAGR) of about 12% and profit CAGR of about 44%. Profit CAGR was therefore around 3.6 times sales CAGR. Return on Capital Employed (RoCE) stood at 24.9%.
Ameya Precision Engineers’ Profit and Sales Growth Over the Years
| Particulars | 2022-23 | 2023-24 | 2024-25 | 2025-26 | CAGR |
| Sales (Rs crore) | 28.5 | 33.9 | 38.5 | 40.2 | 12% |
| Profit (Rs crore) | 1.9 | 3.0 | 4.4 | 5.6 | 44% |
Source: Screener.in
Why Did Profit Grow Faster Than Sales?
The divergence largely reflects steadily improving operating margins rather than exceptionally high revenue growth. Operating margin increased from 10.2% in FY23 to 12.3% in FY24, 15.4% in FY25 and 19% in FY26. Over the same period, operating profit rose from Rs 2.9 crore to Rs 7.6 crore, while sales increased at a much slower pace.
The margin improvement has developed over several years. In its FY25 annual report, management said the improvement in profitability was driven primarily by disciplined cost management, strategic procurement planning and better utilisation of resources. The trend continued in FY26, when revenue rose only 4.3%, while net profit increased 26.1% and operating margin expanded to around 19%.
Working Capital Trends: Assessing Cash Flow and Inventory Pressures
Working-capital days stood at 132 in FY24, 106 in FY25 and 140 in FY26. The FY26 increase deserves attention, although the latest level remained below the 178 days recorded in FY23. Cash conversion cycle was also relatively stable at around 108 days versus 111 days in FY24.
Ameya Precision Engineers’ Working Capital Days
| Particulars | 2023-24 | 2024-25 | 2025-26 |
| Working Capital Days | 132 | 106 | 140 |
Debtor days, however, increased to about 115 from 73, while operating cash flow fell to Rs 1.95 crore from Rs 5.98 crore. Debt-to-equity remained below 0.01 times. Promoter holding increased marginally to 72.45% in March 2026 from 72.29% a year earlier.
The key test is whether Ameya can sustain its higher margins while improving collections. SME liquidity risks and half-yearly reporting also warrant investor caution.
We previously examined Ameya’s business profile, export exposure, DRDO supply relationship and expansion plans in our detailed article on precision SMEs supplying defence components. Those aspects are therefore not repeated here.
Conclusion
Profit growing much faster than sales can point to improving operating leverage, better product mix or tighter cost control. But the headline CAGR alone is not enough.
The three companies in this list cleared the broader quality screen and also showed profit growth of more than three times sales growth over three years. Their working-capital trends were then checked to ensure that faster earnings growth was not being accompanied by a sharp rise in capital requirements.
Even so, the reasons behind the profit acceleration differ. In some cases, margin expansion reflects a stronger product mix or operating efficiencies. In others, a low earnings base or accounting treatment can amplify the CAGR. Investors should therefore look beyond the growth multiple and track whether margins, cash flows and working-capital discipline remain sustainable.
SME stocks also carry additional risks, including lower liquidity, wider price swings and limited trading volumes. These companies should therefore be viewed as a starting point for further research rather than as investment recommendations.
Three SME Stocks: Growth and Operating Performance
| Metric | Virtual Galaxy | Gayatri Rubbers | Ameya Precision |
| 3-year sales CAGR | 46% | 23% | 12% |
| 3-year profit CAGR | 195% | 83% | 44% |
| Profit growth vs sales growth | 4.2x | 3.5x | 3.6x |
| FY26 operating margin | 46% | 21% | 19% |
| FY26 working capital days | 36 | 122 | 140 |
Sources: Screener.in and Screener data for three-year growth, operating margins, debtor days and working-capital days. FY26 operating cash flow from company financial statements and reported financial data for Virtual Galaxy Infotech, Gayatri Rubbers and Chemicals and Ameya Precision Engineers.
You can track how these are progressing by adding stocks to your watchlist.
Disclaimer
Note: We have relied on data from www.Screener.in throughout this article. Only in cases where the data was not available, have we used an alternate, but widely used and accepted source of information.
The purpose of this article is only to share interesting charts, data points and thought-provoking opinions. It is NOT a recommendation. If you wish to consider an investment, you are strongly advised to consult your advisor. This article is strictly for educative purposes only.
Ekta Sonecha Desai has a passion for writing and a deep interest in the equity markets. Combined with an analytical approach, she likes to deep dive into the world of companies, studying their performance, and uncovering insights that bring value to her readers.
Disclosure: The writer and her dependents do not hold the stocks discussed in this article.
The website managers, its employee(s), and contributors/writers/authors of articles have or may have an outstanding buy or sell position or holding in the securities, options on securities or other related investments of issuers and/or companies discussed therein. The content of the articles and the interpretation of data are solely the personal views of the contributors/ writers/authors. Investors must make their own investment decisions based on their specific objectives, resources and only after consulting such independent advisors as may be necessary.