




When investors rushed into gold and silver ETFs in 2025 and 2026, chasing the rally in precious metals, few of them were thinking about asset management company (AMC) stocks. But one AMC has quietly emerged as a major beneficiary of that trade, and it shows up directly in its share price. It’s Nippon Life Indian Asset Management Company.
Nippon AMC is one of the top-performing listed AMC stocks, with its shares gaining over 42% in the past year.
Nippon Life India AMC: 1 Year Stock Price Chart
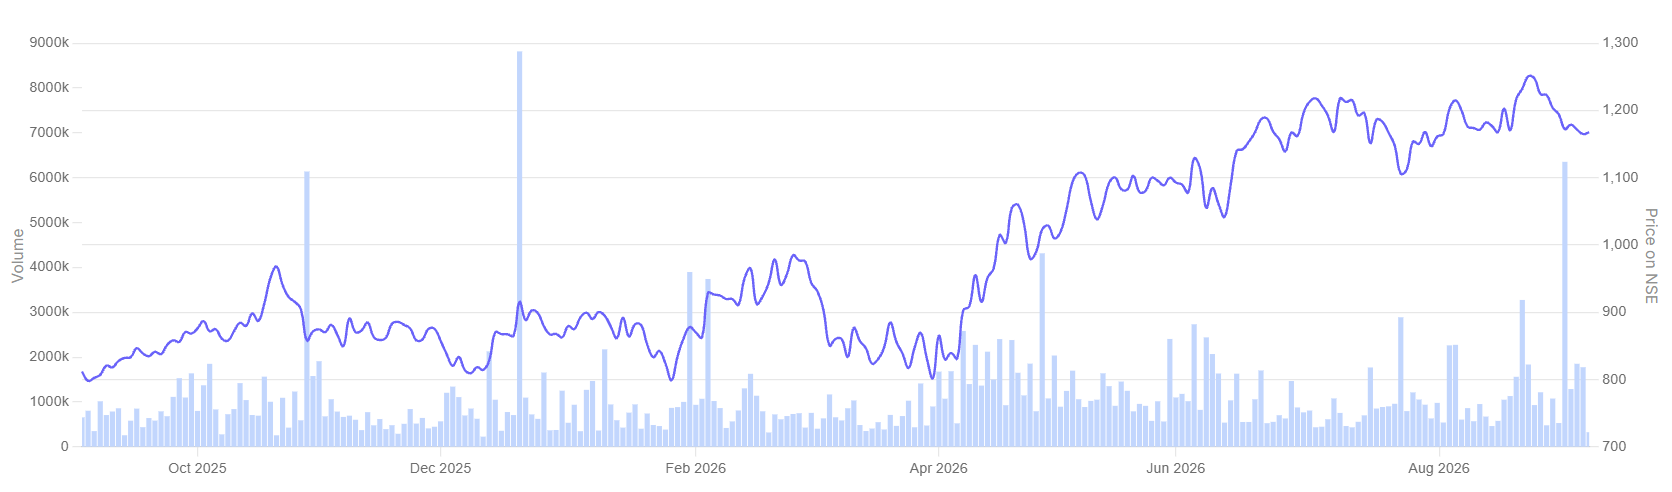
Earlier this year, Nippon’s combined gold and silver ETF assets crossed ₹1 lakh crore, making it the category leader. That number has since come down as precious-metal prices cooled, pulling down the value of assets held by these ETFs.
But the fall in AUM hasn’t changed the bigger picture: Nippon remains the clear leader in gold and silver ETFs. As per AMFI data for June 2026, the combined assets of gold and silver ETFs across the industry stood at ₹2.49 lakh crore. Nippon’s combined AUM was nearly ₹87,320 crore, giving it a 35% market share.
So while the precious-metal rally has faded as a short-term AUM tailwind, Nippon’s dominance in the category remains intact. This boost in gold and silver ETF AUM has supported Nippon’s overall growth. At the same time, its rising equity mix is shifting AUM towards products that typically generate higher management fees.
AUM is Shifting Towards Higher-growth Segments
The shift towards equity is another important tailwind for Nippon. Equity assets typically generate higher management fees than debt funds. So, as the AUM mix tilts towards equity, an AMC can grow revenue faster than its overall AUM.
Rising Equity Mix in Total AUM
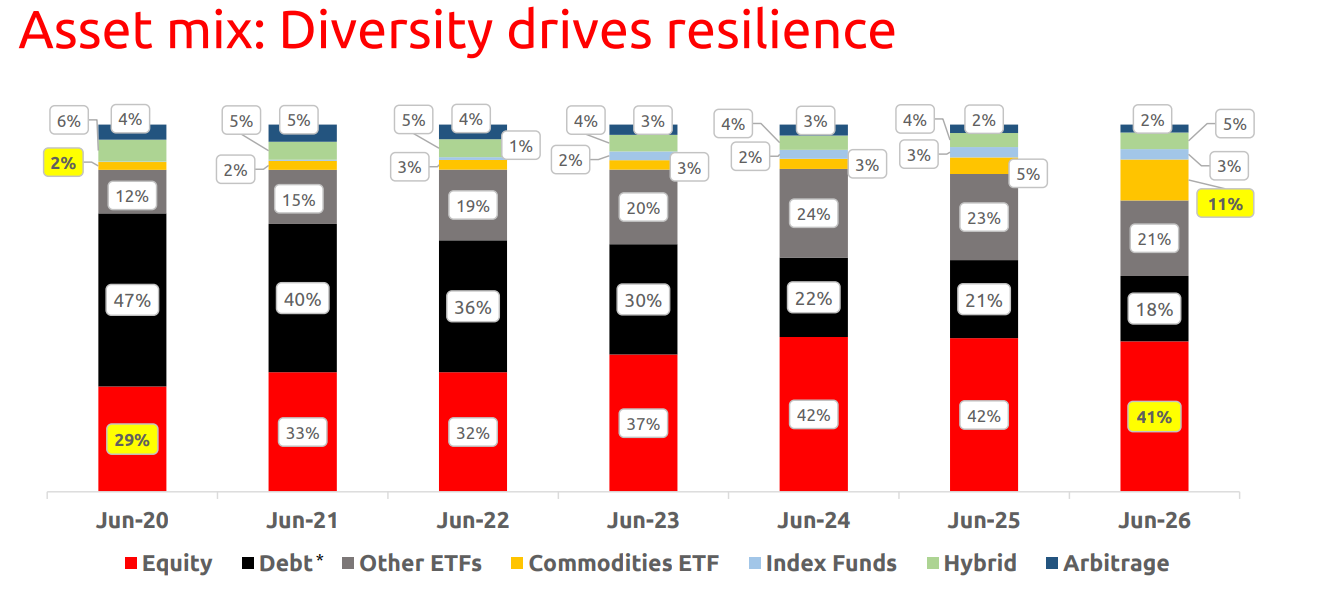
The share of equity assets in total AUM has increased sharply, from 29% in June 2020 to 41% in June 2026. At the same time, commodities ETFs have grown from 2% to 11%. The biggest shift has been in debt funds, whose share of AUM has fallen from 47% to 18% over the same period.
This shift has benefited Nippon, which is gaining market share. Its total mutual fund AUM stood at ₹7.5 lakh crore at the end of June 2026, while its quarterly average AUM market share rose to 9.04% in June 2026 from 7.28% in June 2023, a gain of 1.76%.
More importantly, this is not simply industry-wide growth. Nippon remains the fastest-growing AMC among the top 10 players, while seven of the top 10 AMCs lost market share over the same period.
That makes the change more significant. Nippon is not just riding the growth in India’s mutual fund industry; it is taking a larger slice of that growth.
SIP Flows are Strengthening the Growth Engine
The SIP numbers tell a similar story. Nippon’s quarterly SIP inflows have grown from ₹1,940 crore in FY22 to ₹10,590 crore in FY26, a 445% increase in four years. The momentum has continued in FY27, with monthly SIP inflows staying between ₹3,630 crore and ₹3,720 crore in April, May, and June. For Q1FY27, total SIP flow was ₹11,030 crore.
Growing SIP Flows and Stickiness
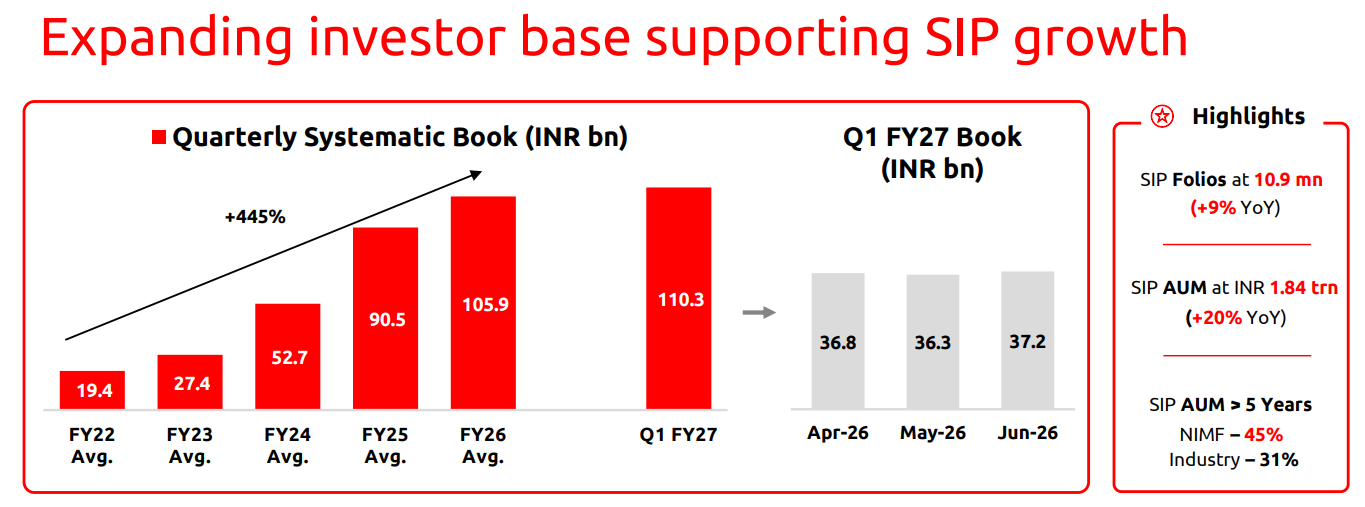
The growth is also visible in the customer base. Nippon’s SIP folios have reached 10.9 million, up 9% year-on-year, while SIP AUM has crossed ₹1.84 lakh crore, up 20%. But the more important number is how long investors stay invested. Around 45% of Nippon’s SIP AUM has remained invested for more than five years, compared with just 31% for the industry.
That matters because SIP money is more valuable when it stays invested for longer. Nippon is not just attracting more systematic money; it is building a stickier asset base. For an AMC, that creates a more predictable and recurring revenue stream.
The Numbers Behind the Re-rating and How the Pack Compares
The market-share gains are now showing up in earnings. And this is where Nippon’s story gets more interesting. HDFC AMC still makes more money in absolute terms, but Nippon is growing its profits much faster.
FY26 Annual Financial Performance of Leading AMCs
| AMC | Revenue | YoY Growth | Net Profit | YoY Growth |
| Nippon Life India AMC | 2,709 | 21.40% | 1,529 | 18.90% |
| HDFC AMC | 4,119 | 17.70% | 2,859 | 16.20% |
| ICICI Prudential AMC | 5,765 | 23.10% | 3,298 | 24.40% |
| Aditya Birla Sun Life AMC | 1,845 | 9.50% | 975 | 4.70% |
Nippon delivered a strong FY26, with revenue rising 21.4% and net profit increasing 18.9% year-on-year. Its growth was ahead of HDFC AMC and Aditya Birla Sun Life AMC, although ICICI Prudential AMC grew slightly faster.
However, annual numbers only show the broader trend. The Q1FY27 results offer a more recent view of how that momentum is holding up. And here, the gap between the AMCs becomes more noticeable, with Nippon reporting a sharper acceleration in both revenue and profit growth.
Q1FY27 Quarterly Financial Performance of Leading AMCs
| AMC | Revenue | YoY Growth | Net Profit | YoY Growth |
| Nippon Life India AMC | 767 | 26.4% | 504 | 27.3% |
| HDFC AMC | 1,099 | 13.5% | 838 | 12.0% |
| ICICI Prudential AMC | 1,564 | 17.5% | 965 | 23.1% |
| Aditya Birla Sun Life AMC | 463 | 3.6% | 310 | 11.9% |
In Q1FY27, Nippon reported its highest-ever quarterly profit of ₹504 crore, up 27% YoY. The contrast with other listed AMCs is clear. No other listed AMC stocks have reported such a growth in profitability.
So while most AMCs are benefiting from a growing mutual fund industry, Nippon’s profits (in 1QFY27) grew at more than twice the pace of HDFC AMC, ICICI AMC, and ABSL AMC.
Some of the earnings gap is due to the active-passive split. Nippon’s overall AUM mix is still favourable from a revenue perspective. Active funds account for around 65% of its AUM, while ETFs and index funds make up the remaining 35%. This means the company has the scale of a strong passive player without becoming overly dependent on a lower-yield business.
Nippon’s ETF franchise gives it a scale advantage that its listed peers do not have. Once the infrastructure is in place, additional AUM and transactions can be added without a proportionate increase in costs.
Valuation: The P/E Comparison Misses the Real Gap
If you look only at P/E, Nippon clearly looks like the most expensive stock in the group. The stock is trading at a price-to-earnings (P/E) of 45x. HDFC AMC is at 36x, ICICI AMC at 42x, and ABSL AMC at 30.4x.
Valuation Trend
| Metrics | Trailing P/E | 5-yr Median PE | Industry PE |
| Nippon Life India AMC | 45.2 | 31.9 | 36.79 |
| HDFC AMC | 35.8 | 38.0 | |
| ICICI AMC | 42.1 | – | |
| ABSL AMC | 30.4 | 20.6 |
If you look only at P/E, Nippon clearly looks like the most expensive stock in the group. But that misses an important part of the picture: how efficiently these companies are using their capital and how fast their profits are growing.
Capital Efficiency
| Metrics | Return on Equity (FY26) |
| Nippon Life India AMC | 34.5 |
| HDFC AMC | 33.0 |
| ICICI AMC | 85.8 |
| ABSL AMC | 25.5 |
Take return on equity (ROE). Nippon’s ROE stands at 34.5%, slightly ahead of HDFC AMC at 33%. The gap widens against ABSL AMC at 25.5%. ICICI AMC is the clear outlier, with an ROE of 85.8%, far above its listed peers.
The other piece is earnings growth. Nippon’s 45x P/E looks expensive until you put it against its 27% profit growth in Q1FY27.
Growth-adjusted P/E comparison
| AMC | Trailing P/E | Q1FY27 PAT growth | P/E ÷ PAT growth |
| Nippon AMC | 45.2 | 27.3% | 1.67 |
| HDFC AMC | 35.8 | 12.0% | 2.95 |
| ICICI AMC | 42.1 | 23.1% | 1.83 |
| ABSL AMC | 30.4 | 11.9% | 2.60 |
This simple growth-adjusted comparison changes the picture. Nippon has the highest P/E, but it also has the fastest earnings growth. On this simple growth-adjusted measure, Nippon’s premium looks less demanding than its headline P/E suggests.
So the valuation question is not simply “Which AMC has the lowest P/E?” It is “How much am I paying for each unit of earnings growth?” On that measure, Nippon’s premium starts to look more reasonable.
The Premium Now Has To Be Earned
Nippon AMC has already shown it can take market share. Its SIP book is expanding, ETFs are scaling, and profits are growing faster than most listed peers. The market has noticed, and the 45x-plus P/E reflects that confidence.
That makes the next leg of the story harder. Nippon no longer needs to prove that it can grow; it needs to prove that it can keep growing faster than the premium built into its valuation.
For investors, that is the real trigger to watch: continued market-share gains and earnings growth can justify the premium. A slowdown could expose just how much growth the stock has already priced in. Add these stocks to your watchlist and monitor how they execute their growth plans.
Disclaimer:
Note: We have relied on data from www.Screener.in throughout this article. Only in cases where the data was not available, have we used an alternate, but widely used and accepted source of information.
The purpose of this article is only to share interesting charts, data points and thought-provoking opinions. It is NOT a recommendation. If you wish to consider an investment, you are strongly advised to consult your advisor. This article is strictly for educative purposes only.
Deepan Datta has spent over a decade studying stocks and mutual funds. His passion is to uncover interesting stories in the financial markets and share them through his writings with investors at large. He is focused on delivering clear, easy to understand and research-backed insights. Deepan began his career as a Research Associate at S&P Global, where he developed a strong foundation in financial research and data analysis.
Disclosure: The writer and his dependents do not hold the stocks discussed in this article.
The website managers, their employees (s), and contributors/writers/authors of articles have or may have an outstanding buy or sell position or holding in the securities, options on securities or other related investments of issuers and/or companies discussed therein. The content of the articles and the interpretation of data are solely the personal views of the contributors/ writers/authors. Investors must make their own investment decisions based on their specific objectives, resources and only after consulting such independent advisors as may be necessary.