




ACC-Ambuja Merger: The Vote That Ends a 90-Year Run
On 29th September 2026, the shareholders of ACC did something few investors are ever asked to do. They voted to make their company disappear. As per the meeting outcome filed with the BSE, 95.52% of the votes cast backed the plan to merge ACC, set up in 1936, into its parent Ambuja Cements. A day earlier, Ambuja’s shareholders had cleared the merger of Orient Cement with 99.98% of the votes.
The share prices shrugged. Ambuja closed the day at Rs 365, matching its 52-week low. ACC ended at Rs 1,204, only a little above its own low of Rs 1,188. Both stocks are down about 33% over the past year, and together they are now worth roughly Rs 1.13 lakh cr.
And yet, retail investors have not walked away. They have walked in. Ambuja added 66,701 shareholders in the June 2026 quarter alone, and ACC’s shareholder base has grown 42% in under three years as its price slid. Is ACC, at a far lower PE, the better value of the two? The merger math answers that rather neatly. Let’s dive in.
#1 ACC: India’s 90-Year-Old Cement Brand at 12x Earnings
Incorporated in 1936, ACC is one of the oldest names in Indian cement. It makes cement and ready-mix concrete and sells almost entirely in India. The Adani Group took control of it in September 2022, when it bought out Holcim’s India business. Today Ambuja owns 50.05% of ACC.
With a market cap of Rs 22,587 cr, ACC is almost free of debt. It carried borrowings of only Rs 429 cr on its books in March 2026, next to reserves of Rs 20,363 cr.
What 100 ACC Shares Turn into After the Merger
Under the scheme, Ambuja will issue 328 of its shares, with a face value of Rs 2 each, for every 100 ACC shares of Rs 10 each. At the closing prices of 29th September, those 328 Ambuja shares were worth about Rs 1,19,720. The 100 ACC shares were worth Rs 1,20,400.
The gap is less than half a percent. In plain terms, the market already treats every ACC share as a bundle of 3.28 Ambuja shares and nothing more. The merger takes effect from 1st January 2026, and ACC expects it to close during FY27, subject to the tribunal’s final nod. Hold that thought.
ACC’s Revenue Engine vs Shrinking Margins
| Financial Year | CY20 | CY21 | FY23* | FY24 | FY25 | FY26 | 5Y CAGR |
| Sales (Rs cr) | 13,786 | 16,152 | 22,210 | 19,959 | 21,762 | 25,962 | 13% |
| EBITDA (Rs cr) | 2,355 | 2,998 | 1,925 | 3,062 | 3,061 | 2,958 | 4% |
| Net Profit (Rs cr) | 1,430 | 1,863 | 885 | 2,335 | 2,402 | 2,137 | 8% |
Source: Screener.in
EBITDA refers to operating profit before other income. *ACC moved its year-end from December to March, so FY23 covers 15 months. CAGR is calculated over the 63 months from December 2020 to March 2026.
Sales have grown at a healthy 13% a year. Operating profit has not kept pace, rising just 4% a year, which means the margin has shrunk from 17% in CY20 to 11% in FY26.
Net profit looks better at 8%, but read it with care. Other income added Rs 1,175 cr in FY25, and in FY26 the tax rate fell to just 1%. So while profit before tax dropped 31% to Rs 2,157 cr in FY26, net profit fell only 11%.
Margin Pressure and Cash Flow Strains
The June 2026 quarter was rough. Revenue slipped about 5% from a year earlier to Rs 5,808 cr. EBITDA dropped 41% to Rs 457 cr and net profit fell 61% to Rs 147 cr. The operating margin shrank to 8%, from 13% a year ago.
ACC’s results release on the BSE shows EBITDA per tonne falling to Rs 458 from Rs 730, on volumes of 10 million tonnes against 10.7 million tonnes. The company blamed planned maintenance at its larger plants and higher purchases under its master supply agreement with Ambuja. In simple words, a bigger slice of what ACC sold was cement bought from its own parent, and that thins the margin.
The cash flow deserves a look too. ACC’s operations used up Rs 1,364 cr of cash in FY26. Working capital days jumped from 6 to 71, and the time taken to collect dues rose from 20 days to 54.
Why Book Value Traps Retail Investors
On the surface, ACC is the cheapest of India’s large cement stocks. The share is trading at a PE of about 12x compared to the current industry median of 28x. The 10-year median PE for the company is 23x while the industry median for the same period is 25x. It also trades at just 1.1 times book value.
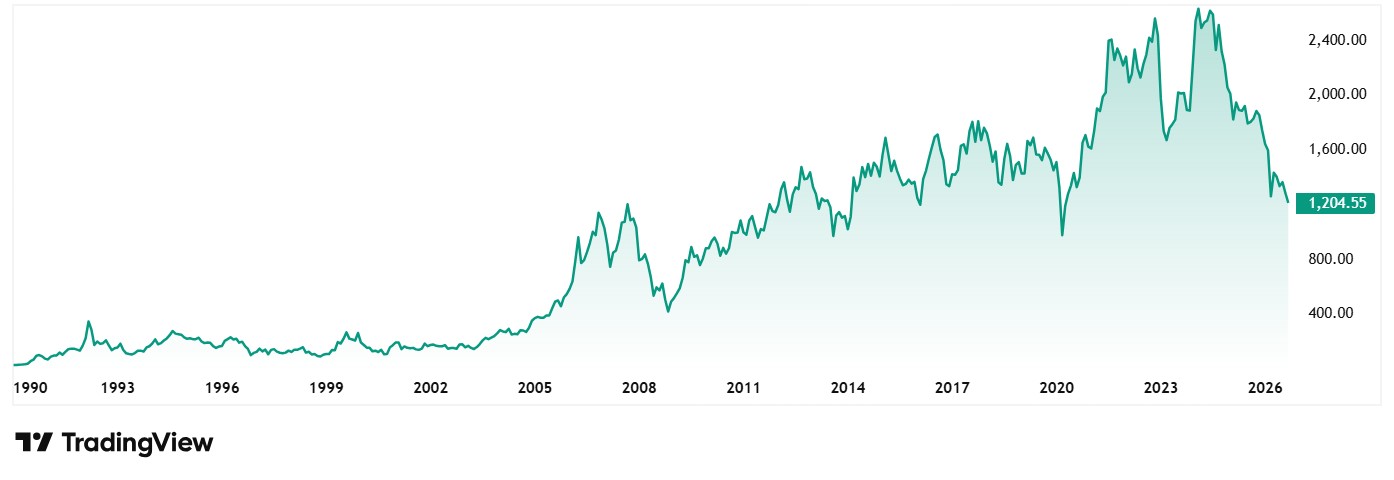
But here is the catch. Because each ACC share will become 3.28 Ambuja shares, anyone buying ACC at Rs 1,204 today is not buying a business at 12 times earnings. They are buying Ambuja at about 19 times. The low PE is an illusion that the swap ratio has already priced away.
The long-term record is sobering. The ACC share price has fallen at a compounded 3% a year over the past decade, and 12% a year over five years. On price alone, a 10-year holder is sitting on a loss.
Shifting Sands in ACC’s Shareholding
That has not put off small investors. ACC’s shareholder count rose from 1,67,639 in September 2023 to 2,38,540 by June 2026, and public holding climbed from 13.26% to 16.19%. Over the same stretch, foreign investors trimmed their stake from 7.10% to 5.83% and domestic institutions from 22.79% to 21.12%. Institutions have been selling. Retail has been buying.
#2 Ambuja Cements: The 109-Million-Tonne Behemoth
Incorporated in 1981, Ambuja Cements is the flagship of the Adani Group’s cement business and ranks as the ninth largest cement producer in the world. The group now includes Ambuja, ACC, Sanghi, Penna and Orient Cement. Together they had a capacity of 109 million tonnes a year as of June 2026, and the company is targeting 119 million tonnes by the end of FY27. The group held a market share of 16.6% as of the September 2025 quarter.
With a market cap of Rs 90,749 cr, Ambuja too is almost free of debt. Borrowings were Rs 866 cr in March 2026, next to reserves of Rs 58,853 cr.
Profitability: Tax Credits and Capital Costs
| Financial Year | CY20 | CY21 | FY23* | FY24 | FY25 | FY26 | 5Y CAGR |
| Sales (Rs cr) | 24,516 | 28,965 | 38,937 | 33,160 | 35,336 | 40,656 | 10% |
| EBITDA (Rs cr) | 5,006 | 6,210 | 5,122 | 6,400 | 5,971 | 6,577 | 5% |
| Net Profit (Rs cr) | 3,107 | 3,711 | 3,024 | 4,735 | 5,294 | 5,637 | 12% |
Source: Screener.in
EBITDA refers to operating profit before other income. Consolidated figures include ACC. FY23 covers 15 months after the change in year-end. CAGR is calculated over the 63 months from December 2020 to March 2026.
The Tax Credits Masking Profit Declines
The net profit line says 12% growth a year. The line above it tells a different story. Profit before tax in FY26 was Rs 3,299 cr, lower than the Rs 3,992 cr earned in CY20, even though sales are 66% higher.
So, what filled the gap? Tax. Ambuja reported a negative tax rate of 71% in FY26, which is how net profit of Rs 5,637 cr ended up higher than profit before tax. Depreciation, the cost of all that acquired capacity, has tripled from Rs 1,152 cr in CY21 to Rs 3,570 cr. Other income has shrunk from Rs 2,646 cr to Rs 516 cr.
Return on capital employed has fallen from 17% in CY21 to 6% in FY26. The share count has also grown, with equity capital rising from Rs 397 cr to Rs 494 cr after the promoters brought in fresh money. Ambuja has bought its growth. It has not yet earned it back.
Will the Margin Recovery Hold?
On a yearly basis, the June 2026 quarter was weak. Volumes dropped 7% to 17.1 million tonnes. Revenue fell 8% to Rs 9,500 cr, EBITDA 19% to Rs 1,589 cr and net profit 37% to Rs 660 cr.
Yet against the March quarter, EBITDA per tonne jumped 27% to Rs 931 from Rs 735. Ambuja’s results filing credits a Rs 206 per tonne cut in costs and a bigger share of retail sales. Management is plainly choosing price over volume, and the margin climbed back to 17% from 13%.
The share is trading at a PE of about 19x compared to the current industry median of 28x. The 10-year median PE for the company is 27x while the industry median for the same period is 25x. It trades at about 1.5 times book value and sits 38% below its 52-week high of Rs 589.
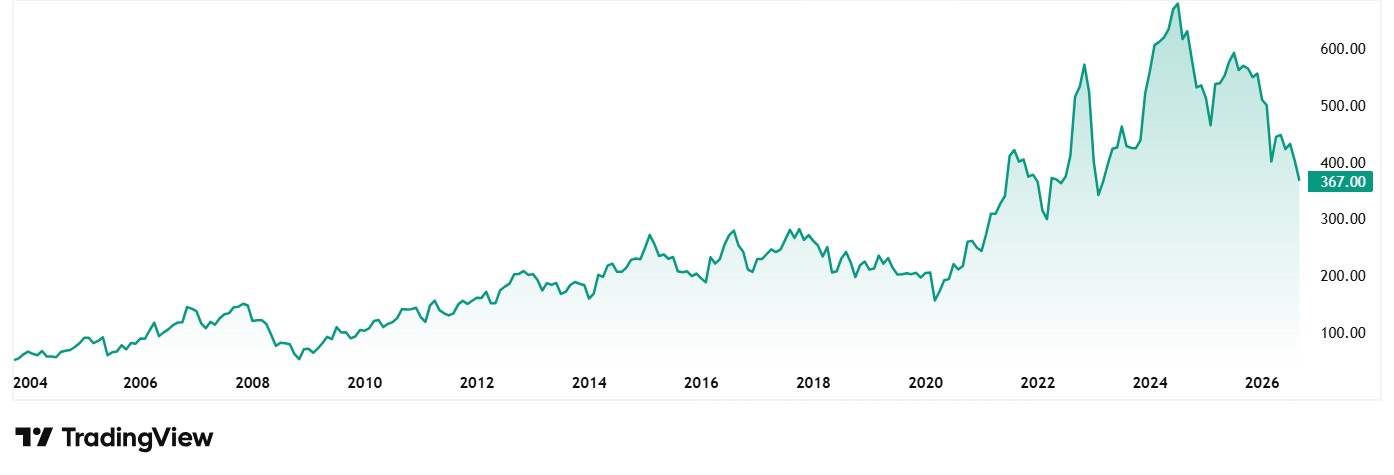
The share price has compounded at just 4% a year over 10 years, and fallen 2% a year over five.
Retail Investors Flock as Institutions Exit
The shareholding has changed hands in a big way. Foreign investors held 11.65% of Ambuja in September 2023. By June 2026 that was down to 5.63%. Domestic institutions moved the other way, from 15.26% to 19.44%. Promoters hold 67.33%.
The shareholder count tells the retail story. It jumped from 6,07,505 in March 2026 to 6,74,206 in June 2026. Once the merger closes, ACC’s 2.4 lakh shareholders will join them, as Ambuja issues roughly 31 cr new shares to ACC holders other than itself.
ACC or Ambuja Cements? The Post Merger Reality
There are two tickers today but, for an investor, only one decision. ACC’s low PE is borrowed from a swap ratio that has already done the pricing.
The real question is whether Ambuja can turn its string of acquisitions into returns. Building a 109 million tonne platform is no small feat. But return on capital sits at 6%, pre-tax profit is below where it was five years ago, and volumes are shrinking. The June quarter’s cost cuts are a start. They will need to hold for several quarters before the market trusts them.
A crowd of new shareholders is not a thesis. The numbers that matter now are EBITDA per tonne, cash flow and return on capital over the next few results, along with fuel costs and the tribunal’s final approval. Anyone tempted by the fall could put both names on a watchlist and let the next two quarters do the talking.
Disclaimer
Note: We have relied on data from www.Screener.in and www.trendlyne.com throughout this article. Only in cases where the data was not available, have we used an alternate, but widely used and accepted source of information, including filings made available on the BSE website.
The purpose of this article is only to share interesting charts, data points and thought-provoking opinions. It is NOT a recommendation. If you wish to consider an investment, you are strongly advised to consult your advisor. This article is strictly for educative purposes only.
Suhel Khan has been a passionate follower of the markets for over a decade. During this period, He was an integral part of a leading Equity Research organisation based in Mumbai as the Head of Sales & Marketing. Presently, he is spending most of his time dissecting the investments and strategies of the Super Investors of India.
Disclosure: The writer and his dependents do not hold the stocks discussed in this article.
The website managers, its employee(s), and contributors/writers/authors of articles have or may have an outstanding buy or sell position or holding in the securities, options on securities or other related investments of issuers and/or companies discussed therein. The content of the articles and the interpretation of data are solely the personal views of the contributors/ writers/authors.