




A falling share price can often make investors question whether something has gone wrong with the business. But that is not always the case. A stock can remain close to its 52-week low even when the company continues to grow its business, report healthy profits, and maintain strong return ratios.
Last week, we looked at this disconnect through Indian Energy Exchange, Jeena Sikho Lifecare, and RailTel Corporation of India. All three stocks were trading close to their 52-week lows, but the reasons behind the weakness were very different. While IEX was dealing with the uncertainty around market coupling, Jeena Sikho was facing questions over how quickly its expansion would translate into earnings, and RailTel’s strong order book had yet to translate into similar growth in profits.
The bigger takeaway was that a stock hitting or approaching its 52-week low does not necessarily mean that the underlying business has weakened. At the same time, strong financial numbers alone do not make a stock a bargain. The reasons for the fall, the valuation, and what could drive the business from here are equally important.
With that in mind, we looked at the next set of stocks that fit the same broad criteria, which includes companies close to their 52-week lows but continue to show strong growth, healthy return ratios, and relatively low debt.
Here, we take a closer look at the next three names and what is driving their businesses as their share prices remain under pressure.
#1 BLS International: Strong Growth, But Stock Volatility Keeps Investors Cautious
BLS International Services Ltd. is one of the two leading Visa & Consular Services globally. The company operates as a technology-enabled global travel and mobility services provider, with businesses spanning visa and consular services and digital services across 100 countries, 46 client governments, and has processed over 490 million applications till FY26.
Why Has The BLS Stock Been Volatile?
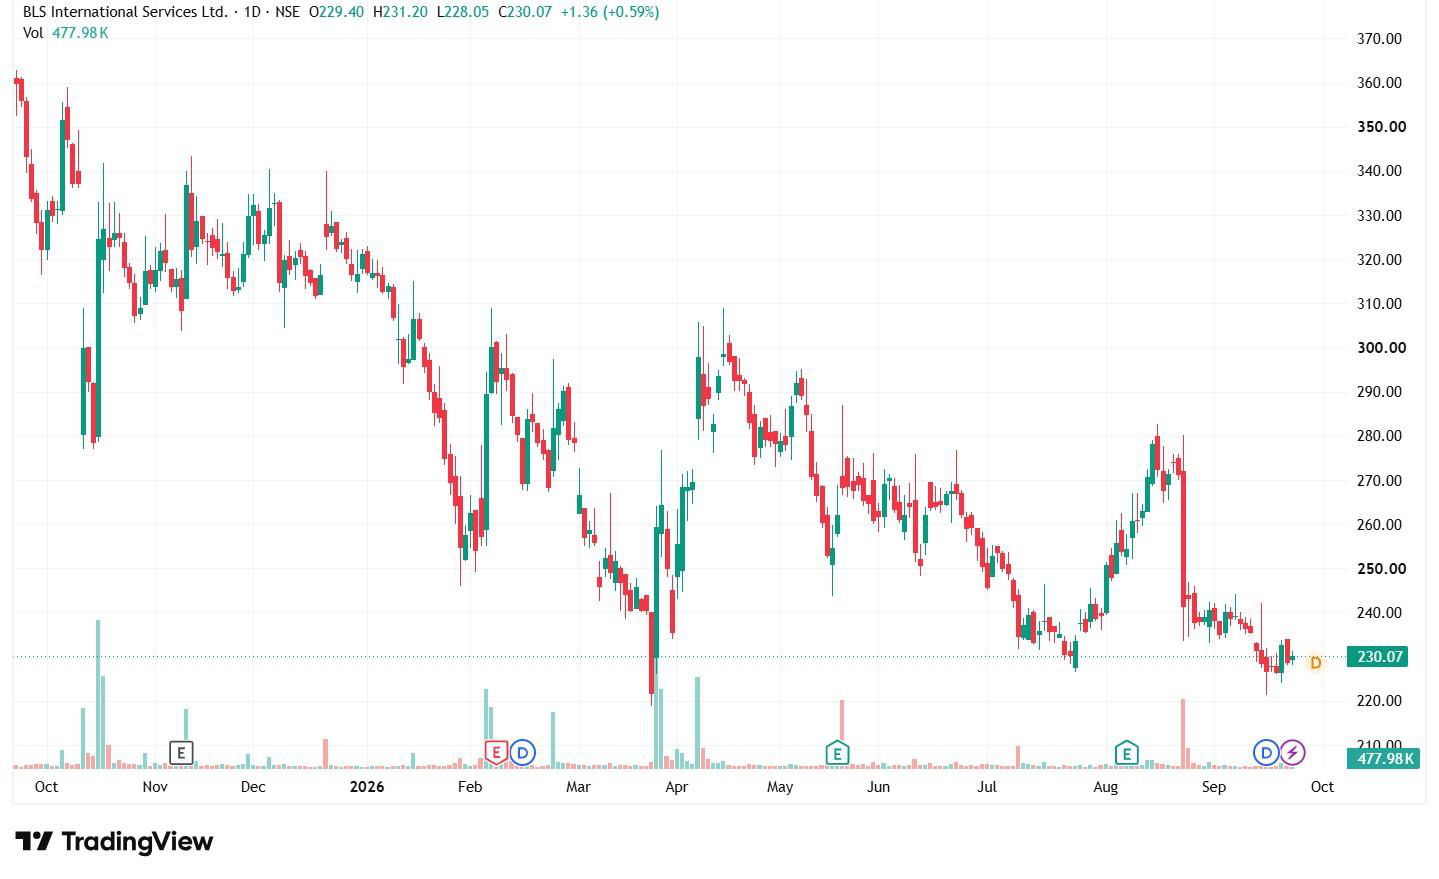
BLS International’s stock touched its 52-week low of Rs 218.9 on NSE on March 23 and has seen sharp moves in both directions since then. A recent sell-off came in August after media reports alleged that the company was linked to a Spanish National Court investigation into alleged visa irregularities.
BLS rejected any involvement in the alleged irregularities, saying there was no evidence of wrongdoing by the company or its employees. The company also said its role is administrative, while decisions on visa processing and issuance rest with the relevant diplomatic and consular authorities.
The stock closed at Rs 230.07 on Sept. 23, just above its 52-week low. It is down 15.14% in one month, 27.40% year-to-date (YTD), and 36.05% over one year. However, over five years, the stock has gained 293.25%.
Numbers Tell A Different Story
While the stock has been near its 52-week low, its revenue for the April-June quarter rose 25.3% YoY to Rs 890.5 crore, while earnings before interest, taxes, depreciation and amortisation (EBITDA) increased 23.6% to Rs 252.4 crore. Profit after tax (PAT) rose 11.4% YoY to Rs 201.6 crore. The management said that all three were record quarterly numbers for the company.
The Visa & Consular business reported revenue of Rs 560 crore, up 21.6% YoY, while EBITDA also rose 21.5% to Rs 226 crore during Q1 FY27. Visa application volumes were broadly stable at 11.3 lakh, but net revenue per application increased 11.2% to Rs 3,521 from Rs 3,167.
The digital business grew even faster compared to the Visa & consumer segment. Revenue from digital business grew 32% to Rs 330 crore, while EBITDA jumped 45% to Rs 27 crore. It is not just the revenue or the EBITDA, but margins also improved to 8.2% from 7.2% during the period, reflecting operating growth.
Expansion Is The Bigger Bet
BLS is targeting 15% to 20% organic revenue growth over the next five years while maintaining around 40% margins in Visa & Consular and improving profitability in digital services.
BLS is also building a new growth avenue through its Aadhaar business. The company won a Rs 2,055.35 crore UIDAI contract to establish and operate district-level Aadhaar Seva Kendras across India for six years, with services including Aadhaar enrolment and updates. Management expects the project to generate around Rs 2,500 crore of revenue over a period of six years, and full revenue contribution is expected from the end of FY27.
Valuation: Has The Fall Made It Attractive?
The stock was trading at a price-to-earnings (P/E) ratio of 13.42x, below the industry median of 38.2x. However, its price/earnings-to-growth (PEG) ratio stood at 0.27x, at par with the industry median.
1-Year Share Price Chart of BLS International Services Ltd.
#2 Interarch Building Solutions: Strong Growth, But Earnings Need To Catch Up
Interarch Building Solutions Ltd. is engaged in the business of manufacturing and supplying pre-engineered building solutions. The company offers end-to-end solutions including designing, engineering, manufacturing, and project execution. The company caters to industries including data centres, electric vehicles, renewable energy, and industrial infrastructure, while expanding into heavy steel structures and export markets.
Why Has The Interarch Stock Fallen?
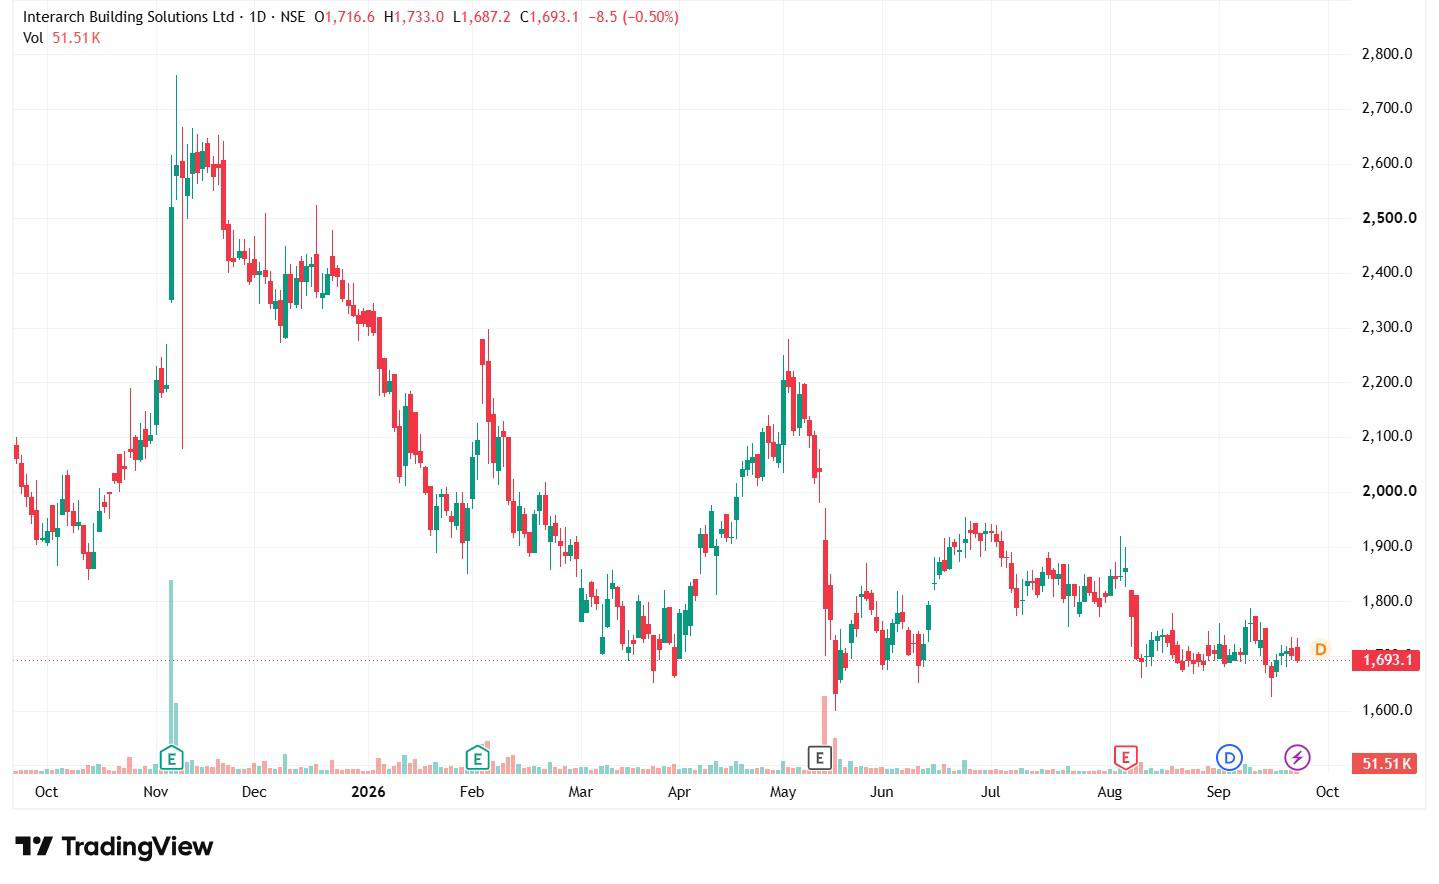
Interarch’s stock has corrected sharply from its 52-week high of Rs 2,762.60 touched in November 2025. The stock hit a 52-week low of Rs 1,600 on May 18 and remains down 26.60% year-to-date and 18.04% over one year.
The weakness has come even as the company continues to report strong revenue growth. In the June quarter, revenue rose 20.7% YoY, while EBITDA increased 24.6%. However, profit after tax remained broadly flat, highlighting the gap between operating growth and bottom-line growth.
The stock closed at Rs 1,693.10 on Sept. 23, just above its 52-week low.
Order Book Keeps The Growth Story Intact
Interarch’s order book stood at Rs 1,864 crore as of July 31, providing visibility for future revenue. This included a Rs 165 crore energy-sector order secured during the quarter. Management expects revenue to reach Rs 2,150 crore to Rs 2,200 crore in FY27 and has raised its FY27-28 revenue projection to Rs 2,700 crore from Rs 2,500 crore.
During Q1FY27, revenue stood at Rs 459.6 crore, up 20.7% YoY, while EBITDA rose 24.6% to Rs 39.4 crore. EBITDA margin also improved to 8.6% from 8.3% in the corresponding quarter last fiscal year. However, profit remained unchanged at Rs 28.2 crore compared to Rs 28.4 crore a year ago.
New Capacity Could Open Another Growth Leg
The company has commissioned Phase 1 of its new PEB facility in Gujarat and is progressing with its heavy steel structures facility in Andhra Pradesh. These plants are aimed at allowing Interarch to take on larger and more complex projects.
Interarch is also setting up a Canada-focused open-web joist business, with the first phase targeting sales between Rs 70 crore and Rs 75 crore and around a 20% EBITDA margin. The company expects exports to become a new revenue stream from FY27-28.
Valuation: Has The Correction Changed The Picture?
The stock was trading at a P/E ratio of 20.81x, higher than the industry median of 15.7x. Even the PEG ratio is at 1.1x, compared to the industry median of 0.26x, indicating that the stock is still relatively more expensive than its peers even after trading near its 52-week low.
1-Year Share Price Chart of Interarch Building Solutions Ltd.
#3 Mazagon Dock Shipbuilders: Strong Order Book, But Stock Correction Keeps Investors Cautious
Mazagon Dock Shipbuilders Ltd. has built some of India’s most important naval platforms, including destroyers and conventional submarines, and has delivered more than 809 vessels since 1960, including 34 warships, eight submarines, and missile boats. Its current shipbuilding capacity allows it to build 11 submarines and 10 warships concurrently.
Why Has The Mazagon Dock Stock Corrected?
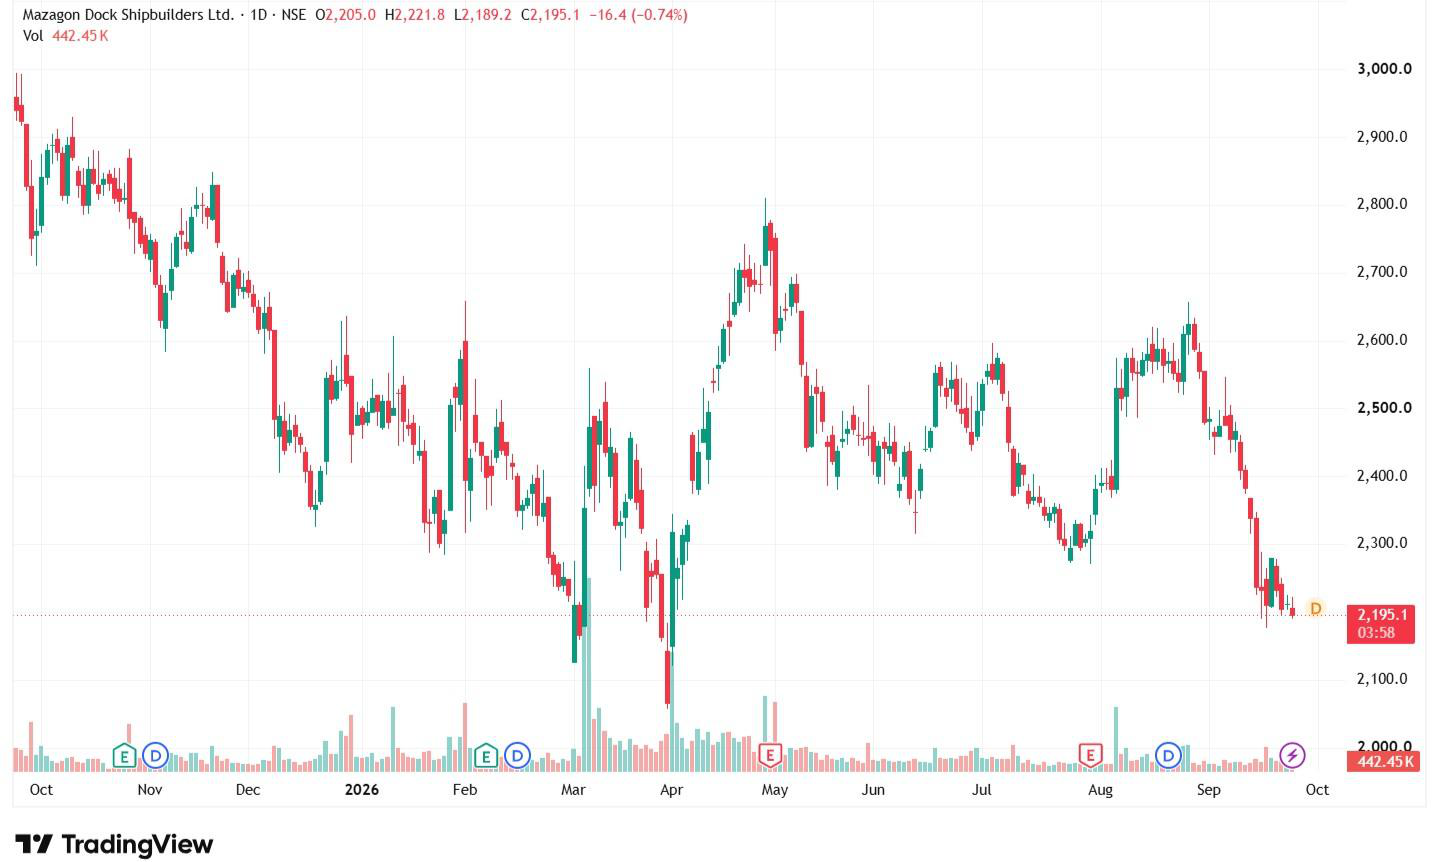
Mazagon Dock’s stock has corrected sharply from its 52-week high of Rs 3,061.40 touched in September 2025. The stock hit a 52-week low of Rs 2,057.40 on March 30 and remains down 10.71% year-to-date and 24.77% over one year. It has also declined 13.34% over the past month.
The stock closed at Rs 2,211.50 on Sept. 23, around 7.5% above its 52-week low. The correction has come despite strong quarterly financial performance.
Revenue during Q1FY27 grew to Rs 2,943 crore, up 12.1% YoY from Rs 2,626 crore, while EBITDA increased 21.6% YoY to Rs 760 crore from Rs 625 crore a year earlier. Profit also increased by around 21.7% YoY to Rs 550 crore from Rs 452 crore in Q1FY26.
As the stock declined even after growth in the business, the focus shifts to the company’s future order inflows and the pace at which its existing order book translates into revenue.
Expansion Could Broaden The Growth Story
Mazagon Dock is also looking beyond its traditional warship and submarine business. The company acquired Colombo Dockyard in FY26, extending its presence in the Indian Ocean, while its annual report highlights a plan to promote its products in international markets.
The company also had a significant execution pipeline, with 34 vessels under active construction as of FY26. This provides a sizeable base for future revenue even as investors track the timing of fresh defence orders.
The company is also venturing into other segments apart from its core defence business. Earlier this month, Maharashtra State Electricity Transmission Co. Ltd. placed a Rs 118 crore order for the supply, installation and commissioning of an AI-based comprehensive infrasecure project for five substations. Apart from this, the company is also focusing on reviving its export business and has bagged export orders for six multipurpose hybrid power vessels.
More recently, the shipbuilder has signed up to participate as an anchor shipyard in proposed greenfield shipbuilding industrial clusters at Dugarajapatnam, Andhra Pradesh, and Dighi in Maharashtra. Both these greenfield clusters will be targeting a minimum of 1.2 million gross tonnes of shipbuilding capacity each, annually.
This strategic expansion can help the shipbuilder strengthen its warships and submarine construction business and transform into a commercial shipbuilder with large-scale capacity, contributing to India’s Maritime goals.
Valuation: Is The Stock At A Discount?
The stock was trading at a P/E ratio of 31x, compared with the industry median of 46x, and its PEG ratio is at 0.97x, lower than the industry median of 1.5x, indicating that the stock is relatively underpriced compared to its peers.
1-Year Share Price Chart of Mazagon Dock Shipbuilders Ltd.
What Should Investors Watch Next?
These three stocks again reflected that a stock trading near its 52-week low doesn’t necessarily mean the business is weak, and it also doesn’t mean they are available at a bargain. While BLS and Mazagon are trading relatively cheaper than their peers, Interarch is relatively expensive even after falling to its 52-week low.
Thus, for investors, it is important to dig deeper into the business instead of looking just at the stock price and making any investment decision, and to do so, one can add these stocks to their watchlist.
We have relied on data from www.Screener.in throughout this article. Only in cases where the data was not available have we used an alternate, but widely used and accepted source of information.
Disclaimer:
The purpose of this article is only to share interesting charts, data points, and thought-provoking opinions. It is NOT a recommendation. If you wish to consider an investment, you are strongly advised to consult your advisor. This article is strictly for educational purposes only.
Maumita Mitra is a seasoned writer specializing in demystifying the world of investment for a broad audience. She has a keen eye for detail and a knack for explaining complex financial concepts in the simplest manner possible.
Disclosure: The writer and her dependents do not hold the stocks discussed in this article.
The website managers, its employee(s), and contributors/writers/authors of articles have or may have an outstanding buy or sell position or holding in the securities, options on securities, or other related investments of issuers and/or companies discussed therein. The content of the articles and the interpretation of data are solely the personal views of the contributors/ writers/authors. Investors must make their own investment decisions based on their specific objectives and resources, and only after consulting such independent advisors as may be necessary.