




A stock does not always need to be expensive to attract attention. Sometimes, the more interesting story lies in value stocks trading below their historical valuations or those of their industry peers.
A low valuation can sometimes tell a more interesting story than a high-growth narrative.
When a company trades below its historical valuation or at a discount to industry peers, it raises the possibility that the market is valuing its earnings or assets lower than it has in the past.
However, a low valuation alone does not make a stock a value stock.
The valuation gap becomes more meaningful when it is accompanied by healthy earnings, cash generation and continued business performance.
Against this backdrop, let’s look at the five undervalued and value stocks using Equitymaster’s powerful stock screener.
#1 Life Insurance Corporation of India
First on the list is Life Insurance Corporation.
Life Insurance Corporation (LIC) is India’s largest insurance provider. It holds a 60.10% market share in first-year premium income (new business premiums) and 60.73% in policies sold in Q1FY27.
It’s also India’s second-largest public sector company by market capitalisation.
The company offers participating and non-participating insurance products, such as unit-linked insurance products, savings insurance products, term insurance products, annuities, and pension products.
It sells products through 1.4 million (m) agents, which is 43.7% of the entire life insurance industry. Its assets under management (AUM) stand at Rs 59.4 tn, up 4.1% from Q1FY26.
The company trades at a price-to-book (PB) multiple of 2.6, a deep discount to its historical 4-year median PB (6.6) and the Life Insurance sector PB (7.2).
This wide valuation gap positions LIC among the sector’s value stocks despite its dominant market share, extensive distribution network and sizeable AUM. Total premium income rose 6.8% to Rs 1.3 trillion (tn), while net profit grew 22.8% to Rs 134.9 billion (bn) in Q1 FY27.
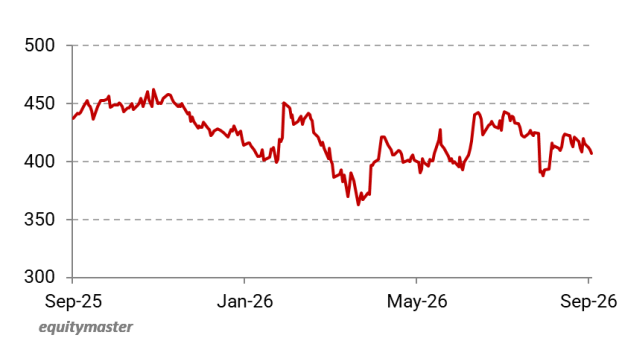
LIC Share Price – 1 Year
Key performance indicators also showed strong momentum. Value of New Business (VNB) surged 61.3% to Rs 31.36 bn, while VNB margin expanded by 750 basis points (bps) to 22.9%.
Management expects VNB margins to settle near the industry average, targeting mid-20s levels.
The value of annual premium equivalent (APE), which measures annualised new business sales volume, grew 8.2% year on year to Rs 136.9 bn in Q1FY27.
Group APE also grew 10.2% year on year to Rs 61.6 bn. The company’s new business premium in group policies also grew 9.2% to Rs 512.3 bn.
#2 Power Finance Corporation
Second on the list is Power Finance Corporation (PFC).
PFC is the primary financier for India’s power sector. It’s a Maharatna Public Sector Undertaking (PSU) majority-owned by the Government of India. As a group, it holds the largest NBFC loan book in India at approximately Rs 11.6 tn.
Its loan asset portfolio directly covers conventional generation (32.6%), transmission & distribution (41%), and renewable energy (15%).
PFC standalone loan assets expanded by 3.7% YoY to Rs 5.7 tn. Net Interest Income contracted by 4.4% to Rs 52.3 bn while Net interest margin moderated by 14 bps to 3.5%. Net profit grew 5.4% to Rs 47.5 bn.
PFC’s valuation stands out as a value stock, with its 0.8 PB multiple at a steep discount to the NBFC sector median of 2.1. While the stock is valued in line with its historical level, it trades at a significant discount to its sector peers.
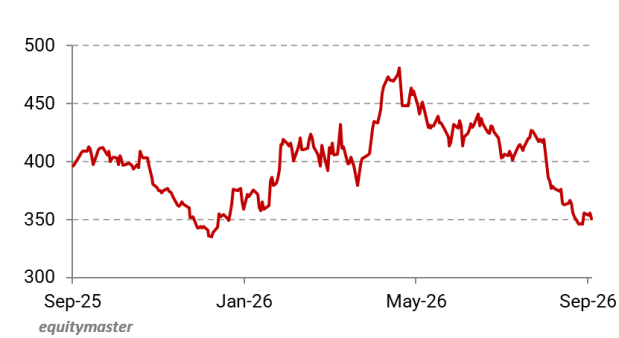
PFC Share Price – 1 Year
PFC is targeting a loan asset growth of around 10% for FY27.
Management expects interest spreads to remain in the 2.4% to 2.5% range for FY27. This stability is supported by the fact that 65% of PFC’s borrowings are fixed-rate, long-tenor liabilities.
PFC is shifting focus toward firm, dispatchable green power, including hybrid solar-wind projects, battery storage, and pumped hydro storage. It has already sanctioned around Rs 160 bn towards battery and pumped storage solutions.
Going forward, capacity additions in India are projected at a 70-30 mix of thermal vs. renewables, and PFC’s lending focus aligns with this trend. The group renewable book stands at Rs 1.6 tn.
#3 NTPC
Third on the list is NTPC.
NTPC has diversified across the entire energy value chain. NTPC operates a diversified fleet of thermal (coal and gas), hydro, and renewable energy (solar and wind) power stations.
As of 30 June 2026, NTPC Group’s operational capacity stands at 90.9 GW. Total group portfolio capacity, including under-construction assets, reaches 126.6 GW.
NTPC accounts for 17% of India’s total installed capacity, generating 24% of the nation’s power supply. NTPC has raised its capacity targets to 150 GW by FY32 and 250 GW by FY37.
Accordingly, the share of fossil fuel-based capacity in NTPC’s portfolio is projected to decline from 82% to 56% by FY32, and to 39% by FY37.
Clean energy will account for nearly 33% of generation by FY37, up from 4% today.
Operational Renewable Energy (RE) capacity stands at 12 GW. NTPC targets to expand its RE capacity to 60 GW by FY32 and 136 GW by FY37. Through NTPC Green Energy (NGEL), NTPC aims to add 7 GW to 8 GW of RE capacity in FY27.
The group has 35.7 GW under construction across all sources (including 16.4 GW of solar and wind assets) and another 12 GW under tendering. On the thermal fleet side, NTPC has 15.7 GW of coal-based capacity currently under construction.
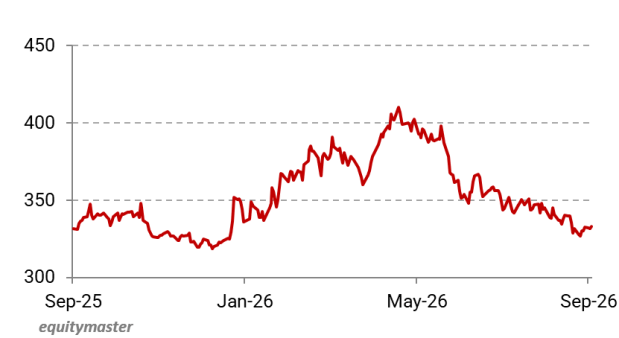
NTPC Share Price – 1 Year
On the Nuclear Power side, through ASHVINI (a joint venture with NPCIL), NTPC is constructing the 2.8 GW (4×0.7 WW) PHWR Mahi Banswara Atomic Power Project in Rajasthan.
NTPC formed NTPC Parmanu Urja Nigam to build and operate nuclear plants, targeting 30 GW of nuclear capacity by FY47 toward India’s 100 GW national nuclear goal. NTPC expects a 2-year capex of Rs 1 tn for FY27 and envisages a total long-term capital deployment of Rs 16.9 tn through FY37.
The company is also investing Rs 1 tn to produce green ammonia, green methanol, sustainable aviation fuel (SAF), and green urea. NTPC is also venturing into coal gasification to supply gas-based power stations during peak demand periods.
Financially, consolidated revenue grew 7.8% year on year to Rs 507.4 bn. Operating profit grew 29% to Rs 162.3 bn with margins at 32%. Net profit surged 12.9% to Rs 68.9 bn.
The stock qualifies as a value stock, trading at a PE of 11.2, below both its historical median of 13.2 and the industry PE of 21.4. The stock is therefore trading at a discount to both its historical valuation and industry peers.
#4 Tata Motors
Fourth on the list is Tata Motors.
Tata Motors Limited is a leading commercial vehicle manufacturer. Its presence spans heavy commercial vehicles, Intermediate, Light, and Medium Commercial Vehicles, small commercial vehicles and pickups, CV passenger, and Electric Commercial Vehicles.
It has a domestic market share of 36.8% overall, led by a 56.3% share in heavy commercial vehicles.
Sales were 26% higher at 108,700 units in the quarter ending 30 June 2026. Standalone revenue surged 23% YoY to Rs 193 bn. EBITDA grew 17% to Rs 22.6 bn while margins declined 60 bps to 11.7%.
However, net profit surged 8.3% to Rs 15.3 bn. The company also generated a positive free cash flow of Rs 11 bn and had a net cash position of Rs 71 bn.
Management expects strong double-digit sales growth to continue into the second quarter of FY27. To offset higher raw material costs, Tata Motors introduced a 2.5% price increase on 1 July 2026.
Electric vehicle sales grew nearly three times YoY, helped by rising diesel prices that made electric vehicles more cost-effective for fleet operators. The company has an order backlog of approximately 4,500 government, defence, and public transport vehicles, including more than 850 electric buses.
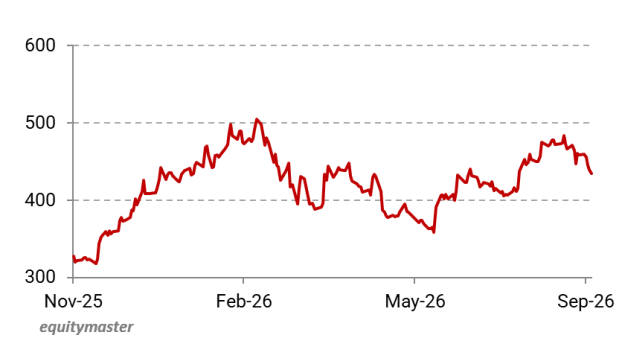
Tata Motors Share Price – 10 Months
Tata Motors secured an order for 70,000 commercial vehicles from Indonesia. The order consists of Yodha pickup trucks and Ultra T.7 light commercial vehicles. Shipments began in Q1FY27, with 2,000 vehicles dispatched. The company will deliver the entire 70,000-unit order over two years, completing it by FY28.
In addition, the company is using this delivery to build brand presence and introduce additional vehicle categories in Indonesia.
Its export sales also grew 35% to 8,100 units during the quarter despite Middle East tensions. To compensate for the slowdown, it’s intentionally driving sales momentum across SAARC member nations and markets in Sub-Saharan Africa.
From a valuation perspective, Tata Motors trades at a PE of 21.5 times, below Ashok Leyland’s (25.7) and the commercial vehicles sector PE of 25.7.
Tata Motors can be classified as a value stock based on its relative valuation, with its PE multiple below both Ashok Leyland and the commercial vehicles sector.
This valuation discount makes the stock stand out relative to peers. The lower multiple is accompanied by positive free cash flow of Rs 11 bn and a net cash position of Rs 71 bn.
#5 Hindustan Zinc
Fifth on the list is Hindustan Zinc.
Hindustan Zinc, part of the Vedanta Group, is an integrated metals and mining enterprise.
The company primarily extracts and processes zinc, lead, and silver through an integrated business model that spans mining and smelting operations.
It targets an annual refined metal output of 1.1 million tons (MT). While zinc and lead make up most of its production volume, silver is a major revenue driver, contributing roughly 46% of its profit.
In addition to its core metals, Hindustan Zinc produces and sells by-products such as sulfuric acid. It’s establishing a phosphoric acid and fertiliser plant at Chanderiya. To diversify its mineral portfolio, the company recently acquired a mining lease for a rare earth elements and Yttrium block in Karnataka.
The company is working to double its refined metal production capacity to 2 MT per year by FY30. Key projects include adding a 250 KTPA integrated zinc smelter at Debari.
The company also plans to expand annual silver production capacity toward a target of 1,500 tonnes. Construction has also begun on a 10 MTPA tailings reprocessing plant designed to extract extra metal from existing waste. This is expected to recover an additional 30 to 35 KT of zinc.
To increase the output of value-added products, it’s building a 510 KTPA fertiliser plant at Chanderiya.
Hindustan Zinc Share Price – 1 Year
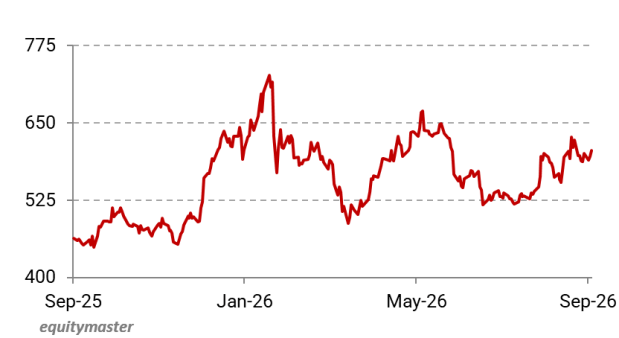
Financially, revenue grew 77% YoY to Rs 137.5 bn, driven by 48% growth in Zinc, 169% in silver, and 25% in Lead. EBITDA rose 109% to Rs 80.7 bn, with margins at 59%. Net profit grew 145% to Rs 54.7 bn. The company generated a free cash flow of Rs 52.4 bn during the quarter.
Valuation-wise, the company trades at an EV/EBITDA of 9.3, below its historical 3-year median of 11.4.
The company also generated free cash flow of Rs 52.5 bn during the quarter, providing further context to its operating performance.
Conclusion
The five companies come from very different parts of the economy, but their recent numbers show the value story isn’t based on valuations alone.
LIC delivered 22.8% growth in net profit and a 61.3% rise in VNB, while PFC continued to expand its loan assets and is targeting around 10% growth in FY27.
NTPC is combining strong earnings growth with a large capacity expansion pipeline, including its push into renewables and nuclear power.
Tata Motors reported 26% growth in quarterly sales, positive free cash flow of Rs 11 bn and a net cash position of Rs 71 bn. Hindustan Zinc delivered 77% revenue growth and 145% net profit growth along with Rs 52.5 bn in free cash flow.
Together, these numbers show that the five stocks have distinct earnings, growth and cash-generation drivers that could shape how their value characteristics evolve over time.
However, instead of relying solely on hype, investors need to carefully analyse the company’s fundamentals, including financial performance, corporate governance practices, and growth strategies.
Happy investing.
Disclaimer: This article is for information purposes only. It is not a stock recommendation and should not be treated as such. Learn more about our recommendation services here…
The website managers, its employee(s), and contributors/writers/authors of articles have or may have an outstanding buy or sell position or holding in the securities, options on securities or other related investments of issuers and/or companies discussed therein. The content of the articles and the interpretation of data are solely the personal views of the contributors/ writers/authors. Investors must make their own investment decisions based on their specific objectives, resources and only after consulting such independent advisors as may be necessary.